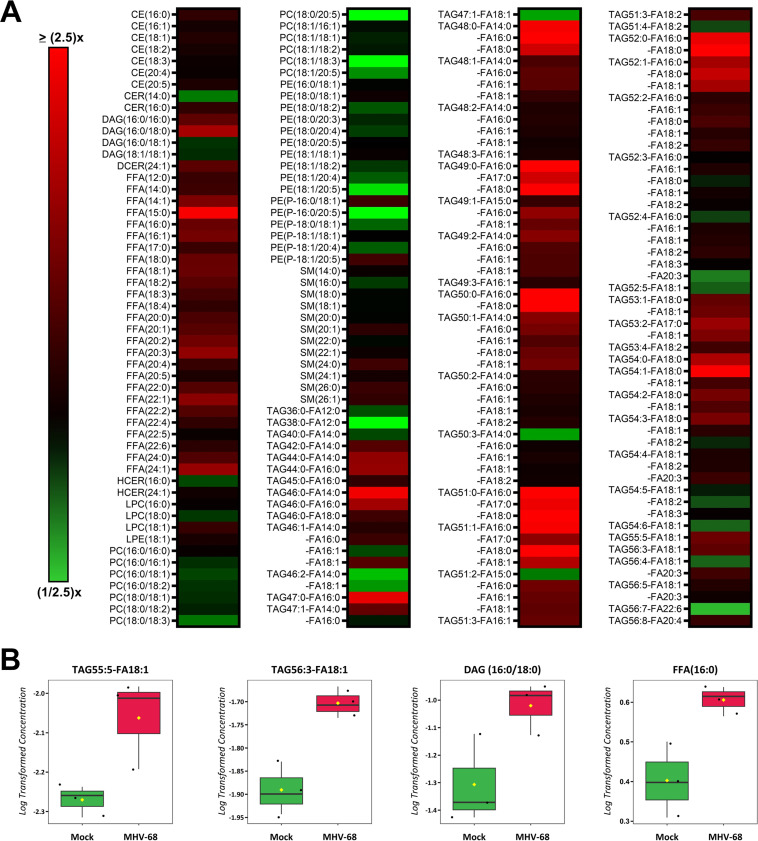
FIG 6.
Quantitative lipidomics of mock versus MHV-68-infected cells at 12 hpi. Mock-infected (control) and MHV-68-infected (MOI = 3) NIH 3T3 cells were harvested at 4, 8, 12, 24, or 36 hpi in three independent experiments. CE, cholesterol ester; CER, ceramides; DAG, diacylglycerol; DCER, dihydroceramides; FFA, free fatty acids; HCER, hexosylceramides; LPC, lysophosphatidylcholine; LPE, lysophosphatidylethanolamine; PC, phosphatidylcholine; PE, phosphatidylethanolamine; SM, sphingomyelin; TAG, triacylglycerol. (A) Relative fold change is depicted; red shows an increase and green shows a decrease in lipid concentration in MHV-68-infected cells compared to mock-infected cells. (B) Box plots of the top four statistically significant metabolites (t test P < 0.05 and at least a 1.5-fold change). Black dots represent concentrations for all samples (biological triplicates). The horizontal line indicates the median, and yellow diamond indicates the mean concentration.

