FIG 8.
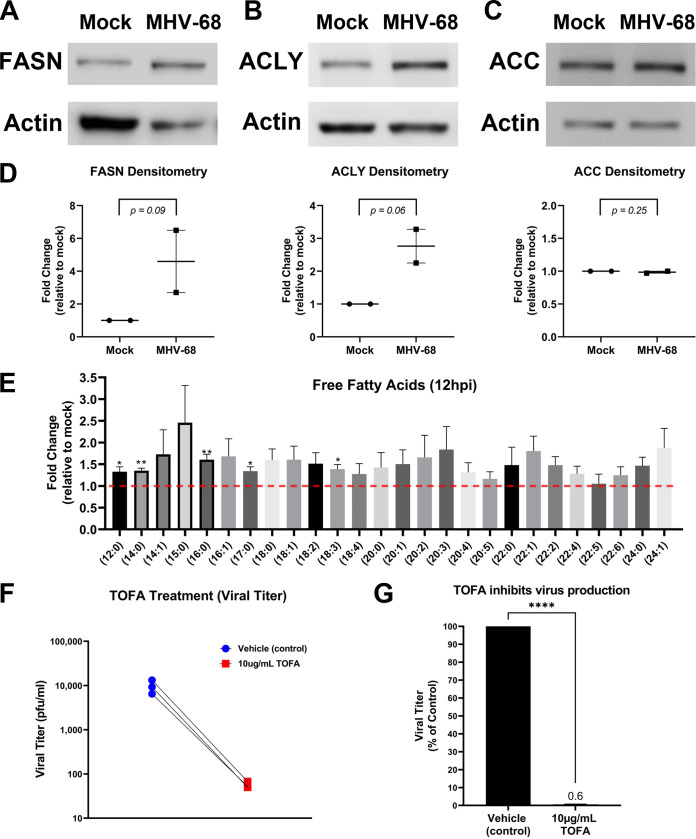
MHV-68 increases and requires lipogenesis for infectious virion production. (A to D) Western blot analysis of fatty acid synthase (FASN), ATP-citrate lyase (ACLY), and acetyl-CoA carboxylase (ACC) in mock-infected versus MHV-68-infected (MOI = 3) NIH 3T3 cells at 24 hpi in two independent experiments. Densitometry analysis results are shown as fold change compared to mock-infected cells, with actin used as a loading control. Ratio paired Student’s t test was used to calculate the P value of densitometry data. (E) Quantitative lipidomics of free fatty acids in mock-infected (control) and MHV-68-infected (MOI = 3) NIH 3T3 cells at 12 hpi (three independent experiments). Unpaired t test (P < 0.05) data are graphed on the y axis as fold change relative to mock infection. The red dashed line at 1.0 indicates no change compared to mock-infected cells. (F and G) NIH 3T3 cells were MHV-68 infected (MOI = 0.1) and treated with 10 μg/mL TOFA or vehicle (control) for 48 hpi in three independent experiments. Viral titer was quantified from cell supernatants via plaque assays and graphed as PFU per milliliter or as a percentage of the control (vehicle treatment). ****, P < 0.0001.

