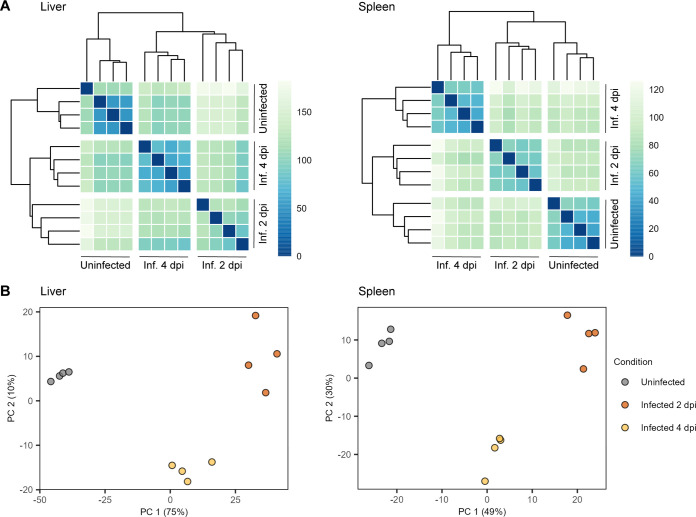
FIG 2.
RVFV infection status determines characteristic gene expression profiles. (A) Heat maps of the Euclidean distances between liver (left) and spleen (right) tissue samples. Based on the calculated distance, each cell is color-coded in shades of a sequential gradient ranging from dark blue (close distance, implying similarity) to light green (far distance, implying dissimilarity). (B) Principal component analyses of liver (left) and spleen (right) tissue samples. Within each tissue type, samples cluster into three distinct well-defined clusters corresponding to a particular infection status. Abbreviations: Inf., infected; dpi, days post-infection.

