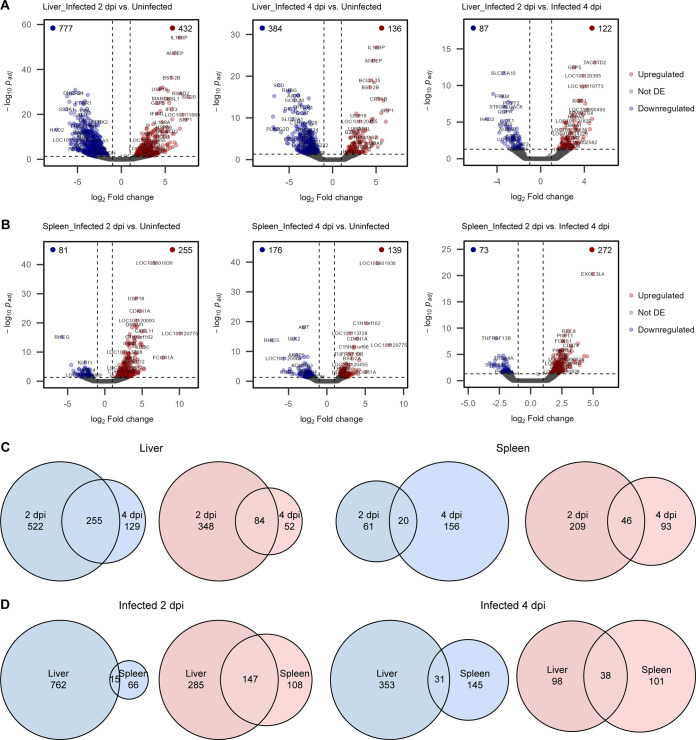
FIG 3.
RVFV-induced changes in liver and spleen gene expression. (A and B) Volcano plots of differential gene expression analysis in liver (A) and spleen (B) tissues. Uninfected (group 1) and infected (groups 2 and 3) samples were compared pairwise. Dots represent individual genes. Genes with an absolute log2 fold change of 1 and a Wald test P value (adjusted by the Benjamini-Hochberg method) <0.05 were considered significantly differentially expressed (DE). The vertical and horizontal dashed lines indicate the log2 fold changes and adjusted P value thresholds, respectively. The numbers of significantly downregulated (blue) and upregulated (red) genes are indicated at the top corners of each plot. (C and D) Euler diagrams representing the numbers of shared (intersection) and unique downregulated (blue) and upregulated (red) genes between infected groups 2 and 3 (compared to control group 1). Comparisons of time points for the same tissue type (C) and comparisons of tissues at the same time point (D) are shown. Abbreviation: dpi, days post-infection.

