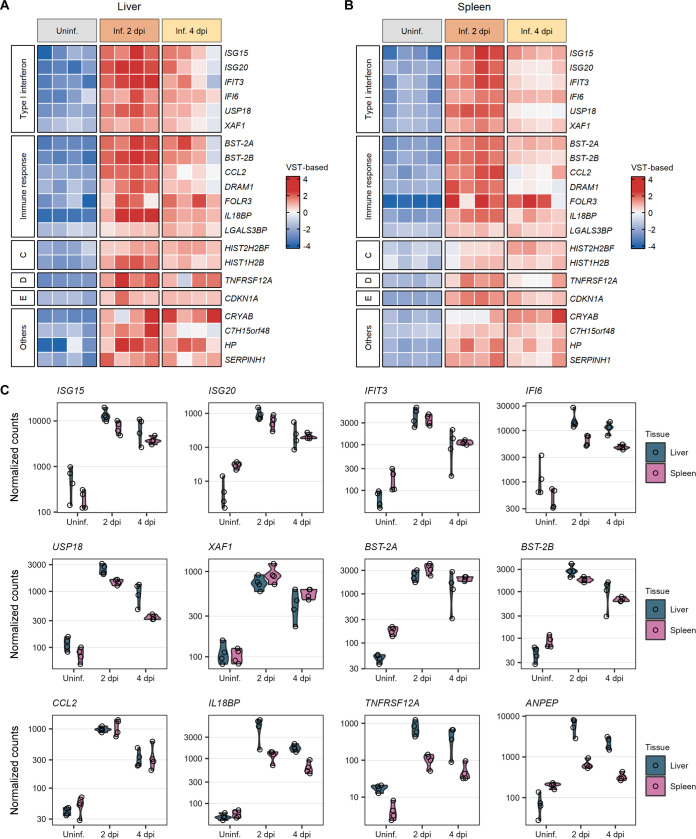
FIG 4.
Commonly upregulated genes in the liver and spleen during peak RVFV infection. (A and B) Heat maps of a set of 21 genes commonly upregulated after RVFV infection in liver (A) and spleen (B) tissues. Samples were clustered based on their infection status, as indicated on top of the heat maps. Genes were clustered into categories based on their molecular function or biological process, as indicated at the left of the heat maps. To represent the magnitude of the log2 fold change of each gene compared to the mean gene expression level, cells are color-coded in shades of a gradient ranging from dark blue (low) to dark red (high). (C) Expression profiles of 12 selected genes commonly upregulated in RVFV-infected (Inf.) samples at 2 days post-infection (dpi) (group 2) and 4 days post-infection (group 3) compared to uninfected (Uninf.) samples (group 1). Dots represent individual normalized gene counts (on a log10 scale), and the shaded area shows the distribution of the samples within each group. Abbreviations: VST, variance-stabilizing transformation; C, nucleosome assembly; D, cytokine receptor; E, apoptosis; Others, a chaperone and genes involved in metabolic processes such as collagen biosynthesis.

