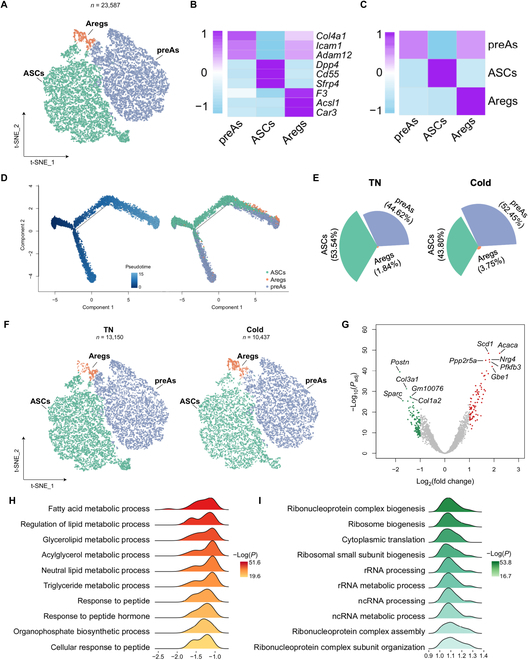
Fig. 2.

Lipid metabolism is potentiated in Areg cells after cold adaptation. (A) t-SNE of ASPC subpopulations. (B) Heatmap showing scaled average expression of selected cell-type-enriched marker genes. (C) Heatmap showing average scaled gene module scores for the top 50 most enriched expressed marker genes in each cluster. (D) The trajectory inference of ASPC subpopulations. (E) The fraction of each ASPC subpopulation in TN and cold-adapted mice. (F) t-SNEs of ASPC subpopulations in iWAT from TN and cold-adapted mice. (G) Volcano plot showing DEGs in Aregs (cold versus TN). (H and I) Top 10 most up-regulated (H) and down-regulated (I) pathways. rRNA, ribosomal RNA; ncRNA, noncoding RNA.
