
Fig. 6.
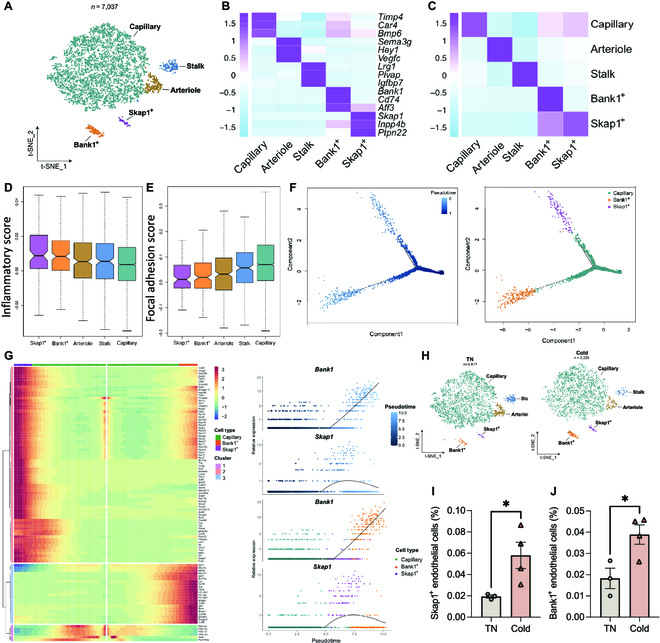
Endothelial cells are derived from stalk cells in iWAT. (A) t-SNE of endothelium subpopulations. (B) Heatmap showing scaled average expression of selected cell-type-enriched marker genes. (C) Heatmap showing average scaled gene module scores for the top 50 most enriched expressed marker genes in each cluster. (D and E) Inflammatory score and focal adhesion score of endothelium subpopulations. (F) The trajectory inference of capillary cells and Bank1+ and Skap1+ endothelial subclusters. (G) Rolling-wave plot showing the spline-smoothed expression patterns of significant pseudotime-dependent genes ordered according to pseudotime point of peak expression. (H) t-SNE of endothelium subpopulations in iWAT of TN and cold mice. (I and J) Flow cytometry analysis of Skap1+ and Bank1+ endothelial cells in mouse iWAT at TN or after cold. *P < 0.05.