Figure 1.
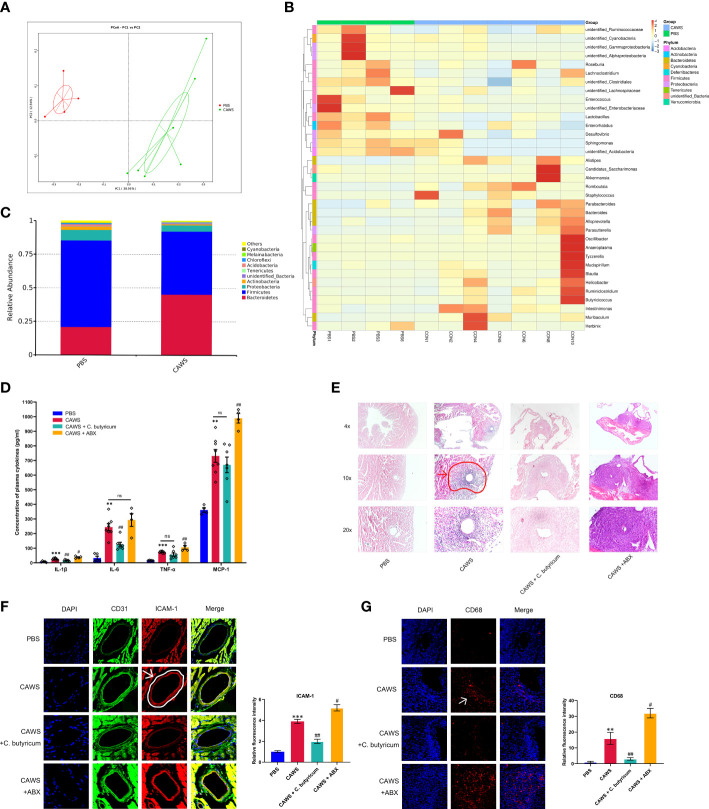
Gut dysbiosis played a role in the inflammation and coronary artery injury of the KD mouse model. (A) PCoA plots of bray-curtis similarity matrices between PBS group (n=4) and CAWS group (n=7). (B) Heatmap of gut microbiota on the genus level. (C) The relative abundance of the gut microbiota in phylum level. (D) Plasma cytokine levels of IL-1β, IL-6, TNF-α, MCP-1. (E) H&E staining of heart tissues. The coronary artery lesion in the CAWS group was circled in red and pointed out by an arrow. Magnification: ×200. Scale bar = 20 μm. (F, G) The expression levels of intercellular cell adhesion molecule-1 (ICAM-1) and macrophage marker CD68 were evaluated using immunofluorescence of coronary arteries. Magnification: × 200. Scale bars = 20 µm. Values are expressed as the mean ± SEM. Significance: ** P < 0.01, *** P < 0.001, vs. the PBS group; # P < 0.05, ## P < 0.01 vs. the CAWS group; ns means no significance.

