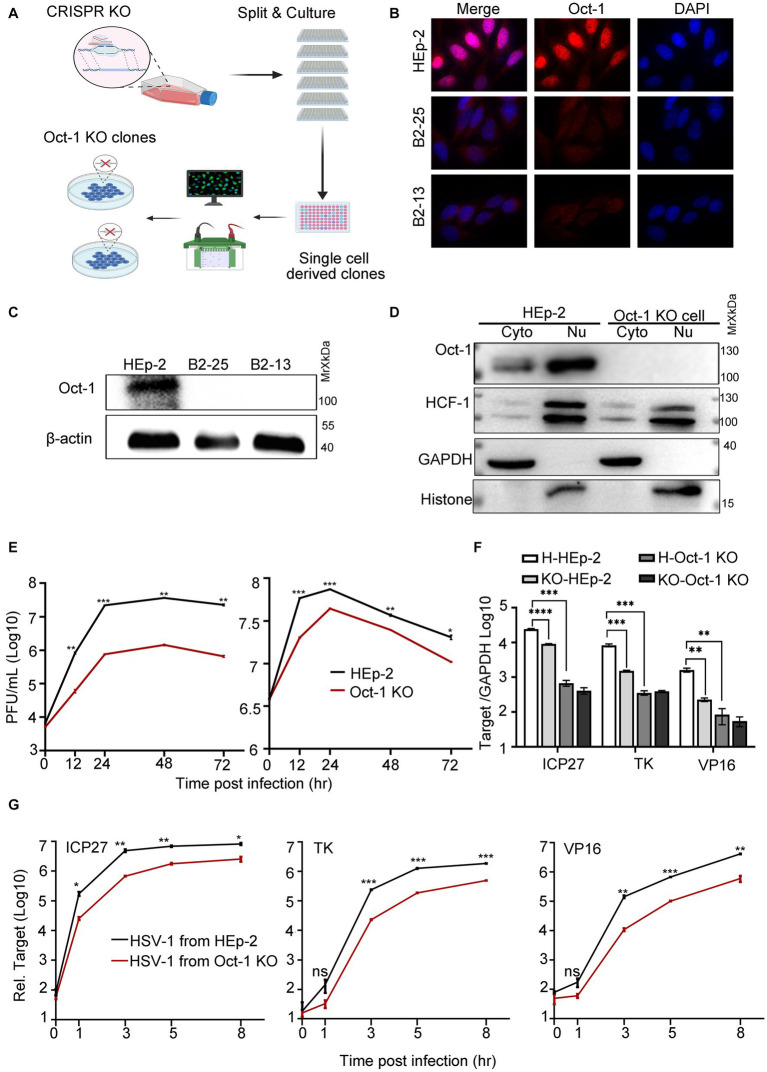
Figure 2.
The effect of Oct-1 protein on HSV-1 replication. (A) Schematic illustration of the experimental workflow for the generation of single-cell-derived KO clones is described in Materials and methods. (B) HEp-2 and two single-cell-derived KO clones (B2-13 and B2-25) were fixed, permeabilized, and reacted with anti-Oct-1 antibody labeled with fluorophores. (C) Lysates of parental HEp-2, B2-13 and B2-25 were immunoblotted with anti-Oct-1 antibody. (D) Subcellular fractions of HEp-2 and Oct-1 KO cells were collected and 40 μL out of 600 μL cytosolic lysate and 40 μL out of 200 μL nuclear lysate were loaded and immunoblotted with anti-HCF-1 and anti-Oct-1 antibodies. Histone and GAPDH served as markers for the origin and purity of the samples. (E) Multicycle growth kinetics of HSV-1 in HEp-2 and Oct-1 KO cells at an MOI of 0.01 (left) or an MOI of 5 (right) by plaque titration of the cell-associated viruses. (F) HEp-2 or Oct-1 KO cells were infected with HSV-1 from HEp-2 and Oct-1 KO cells at an MOI of 0.1. KO-and H-represented cell line Oct-1 KO and HEp-2 used for HSV-1 amplification respectively, and HEp-2 and Oct-1 KO indicated the cell lines that were infected with the viruses. (G) HEp-2 cells were infected with HSV-1 from supernatant of the indicated infected cell lines. The virus stocks from supernatants were prepared by collecting culture medium of HSV-1 infected cells and centrifuging at 800 g for 5 min. Expression levels of the representative α (ICP27), β (ICP8), and γ (VP16) genes at the indicated time points in panel F and G were quantified by quantitative PCR (qPCR; the Ct values of GAPDH of different experimental groups under the above infection conditions remained steady). p-values < 0.05 were marked as “*,” p-values < 0.01 were marked as “**,” p-values < 0.001 were marked as “***,” and p-values < 0.0001 were marked as “****.”

