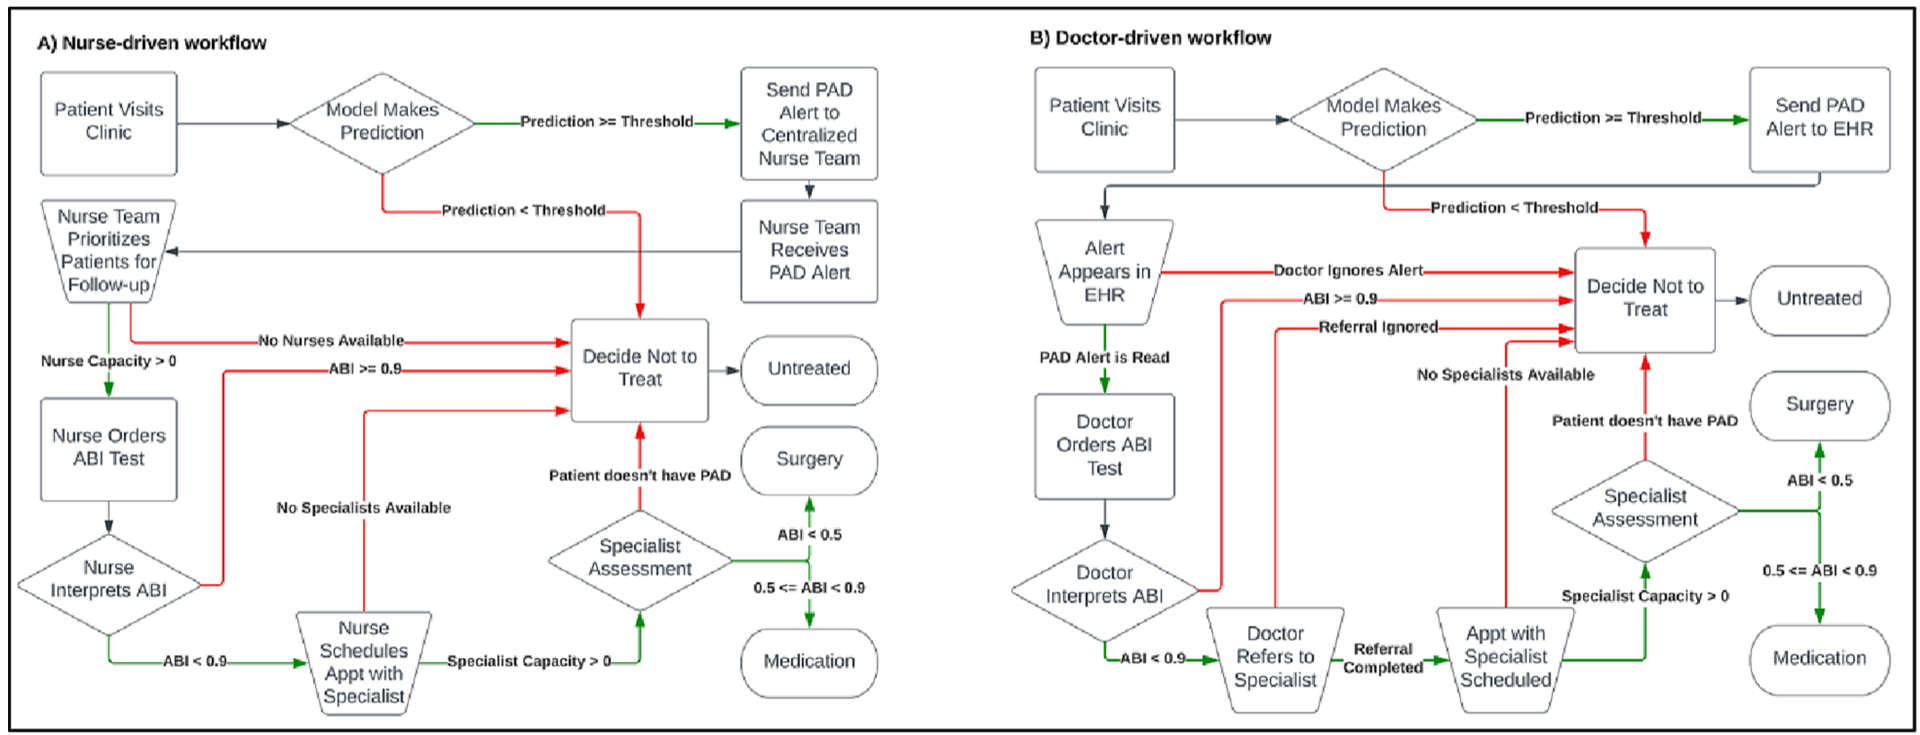
Fig. 1.

States, transitions, and transition conditions for the (a) nurse-driven workflow and (b) doctor-driven workflow. All patients begin at the “Patient Visits Clinic” state in the top left of the charts. Then, patients progress according to their individual-level properties, and end at one of 3 treatment options: “Untreated”, “Medication”, or “Surgery”. Trapezoids represent capacity constraints, diamonds represent decision points, squares are intermediate states, and pills are end states.
