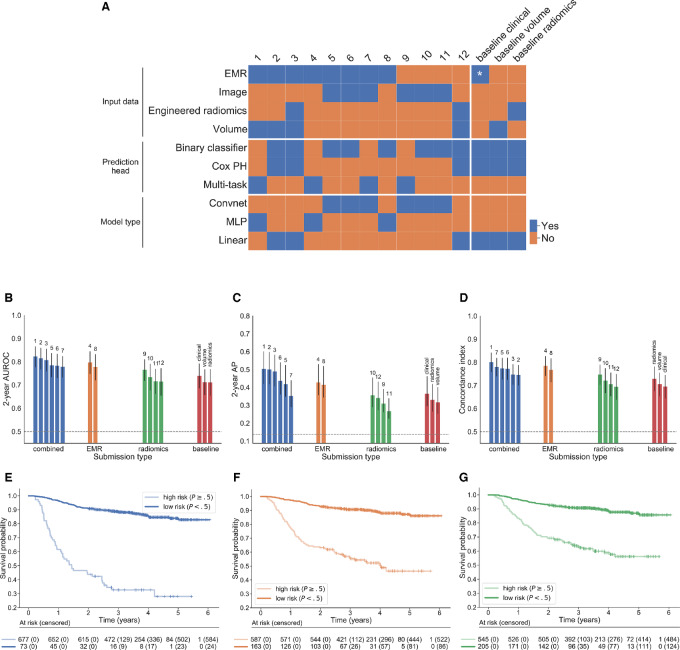
FIGURE 2.
Model results. A, Overview of model characteristics. The characteristics are grouped into input data, prediction head (i.e., how were the survival predictions made) and model type (whether the model involved any nonlinearities and/or convolutions). PH: proportional hazards, MLP: multilayer perceptron, *: age, sex, stage, HPV status. B–D, Performance of all models, including benchmark models, in terms of 2-year AUROC, 2-year average precision and C-index of the lifetime risk, respectively. The results are ranked by AUROC (numbers above bars indicate the overall rank of each model). Error bars represent 95% confidence intervals computed using 10,000 stratified bootstrap replicates. Dashed gray lines indicate random guessing performance (0.5 for AUROC and C-index, 0.14 for AP). E–G, show the Kaplan–Meier survival estimates in low- and high-risk groups identified by the best performing model in each category (combined, EMR only and radiomics), respectively. Test set patients were stratified into two groups based on the predicted 2-year event probability at 0.5 threshold. In each case, there were significant differences in survival between the predicted risk groups (HR, 8.64, 5.96, and 4.50, respectively, p < 10−18 for all).

