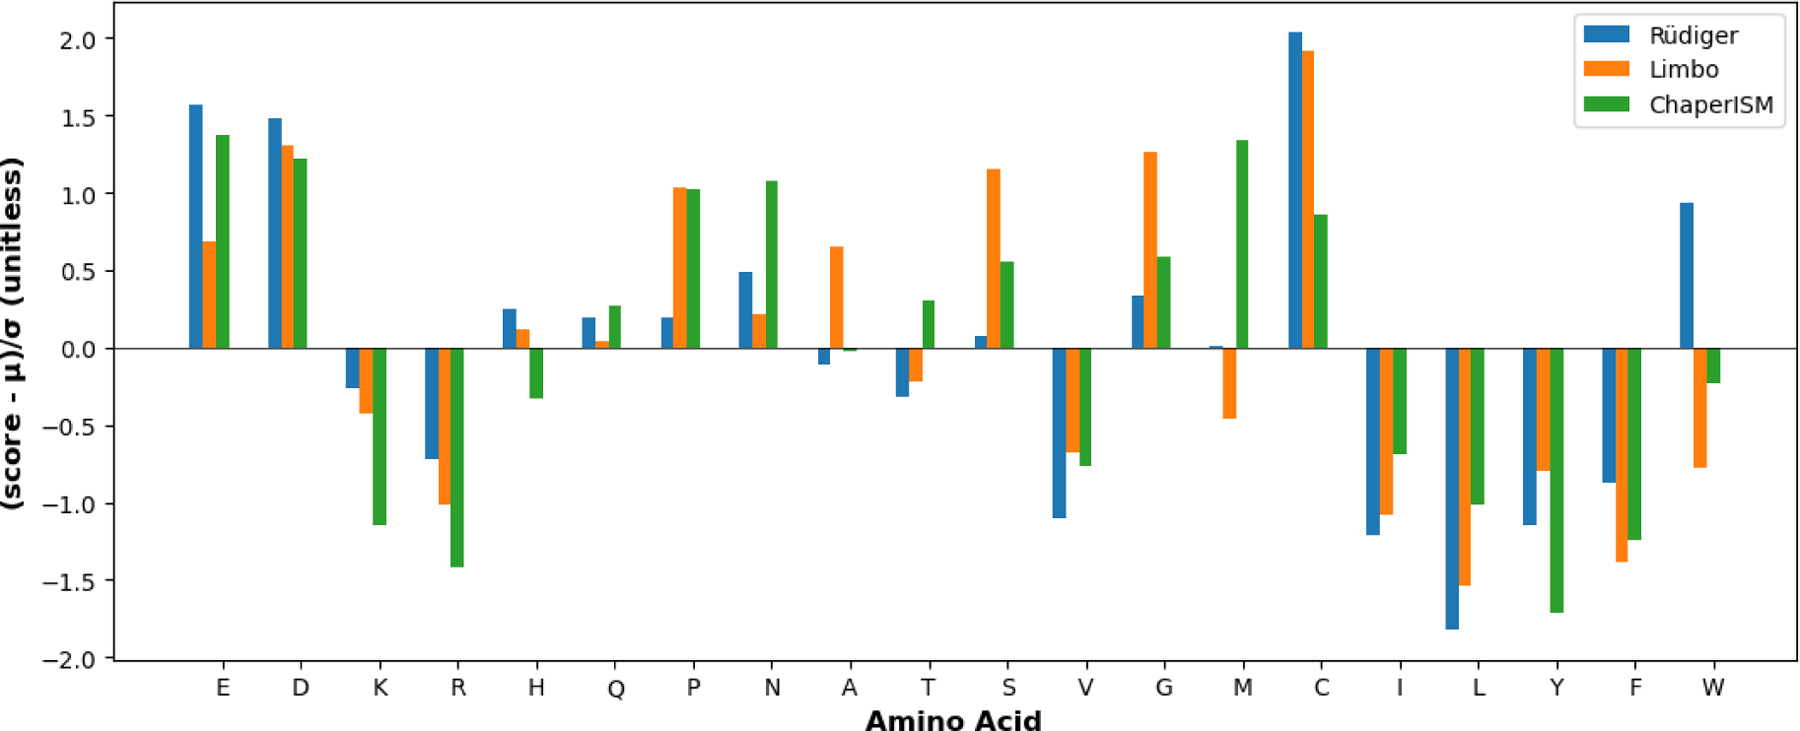
Figure 2. PISMs of Rüdiger et al.,45 Limbo,104 ChaperISM.56.

All scores were standardized according to (score - μ)/σ for direct comparison, where μ is the mean score, and σ is the standard deviation. In the case of Limbo and ChaperISM, the default scores have also been changed to negative values to be comparable to those of Rüdiger model, such a lower score corresponds to stronger binding. For Limbo, the PISM is the average score for all seven sites, and for Rüdiger, it is the average score for the inner five residues. This plot is drawn with Matplotlib.105
