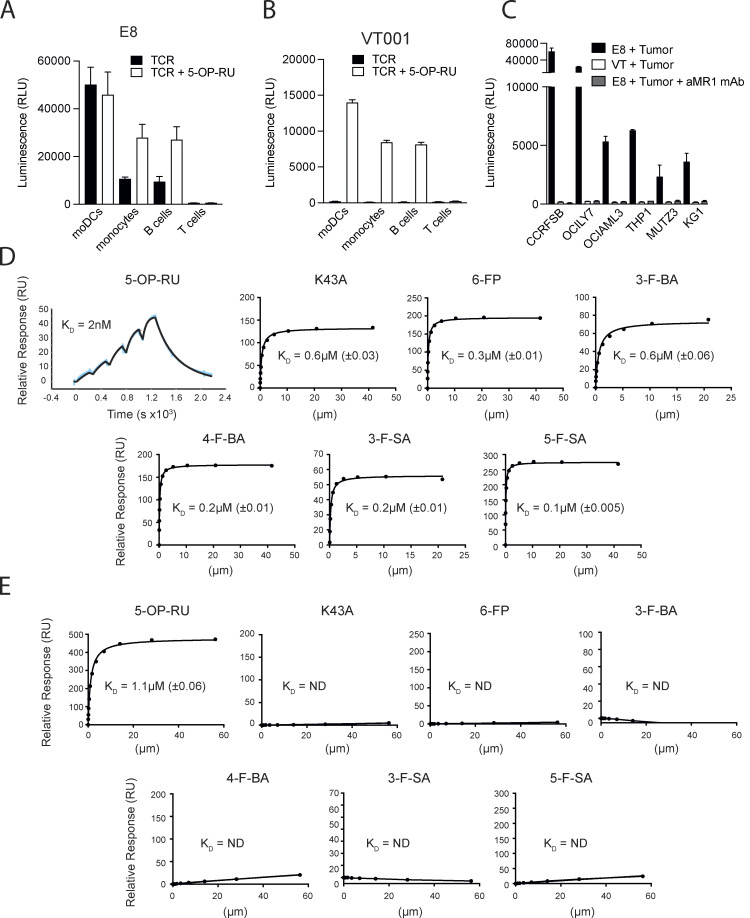
Figure 4.
Broad self-reactivity and promiscuous recognition of MR1 ligands by the E8 TCR. (A) Recognition of primary immune cells in the absence (black bars) or presence (white bars) of 5-OP-RU by E8 TCR transduced NFAT-Luciferase TCR-null B2M knock-out Jurkat cells. (B) Recognition of primary immune cells in the absence (black bars) or presence (white bars) of 5-OP-RU by VT001 TCR-transduced NFAT-Luciferase TCR-null B2M knock-out Jurkat cells. (C) Recognition of lymphoma cell lines by NFAT-Luciferase TCR-null B2M knock-out Jurkat cells expressing the E8 TCR (black bars), the VT001 TCR (white bars), or the E8 TCR in the presence of blocking aMR1 mAb (gray bars). (A–C) Luminescence measured following NFAT-driven luciferase activity is shown as the cumulative relative luminescence units (RLU) data from three experiments with mean ± SD of duplicate cultures. (D) Binding affinities, as measured by surface plasmon resonance, of the E8 TCR interacting with wildtype MR1 refolded with the indicated range of MR1 ligands, and the empty MR1-K43A mutant. Dissociation constant values (KD) are indicated ± standard error. >150 μM: the measured KD of the TCR MR1 interaction >150 μM and therefore is unlikely to elicit a MAIT cell response. The very high binding affinity of the E8 TCR to MR1 5-OP-RU was measured using the BIAcore8K using single-cycle kinetic analysis. The remaining measurements were performed on a BiacoreT200 and the KDs were calculated using steady-state analysis. (E) Binding affinities, as measured by surface plasmon resonance, of the control AF-7 TCR interacting with wildtype MR1 refolded with the indicated range of MR1 ligands, and MR1-K43A. KD are indicated ± standard error. >150 μM: the measured KD of the TCR MR1 interaction was >150 μM and therefore is unlikely generate a MAIT cell response. Source data are available for this figure: SourceData F4.

