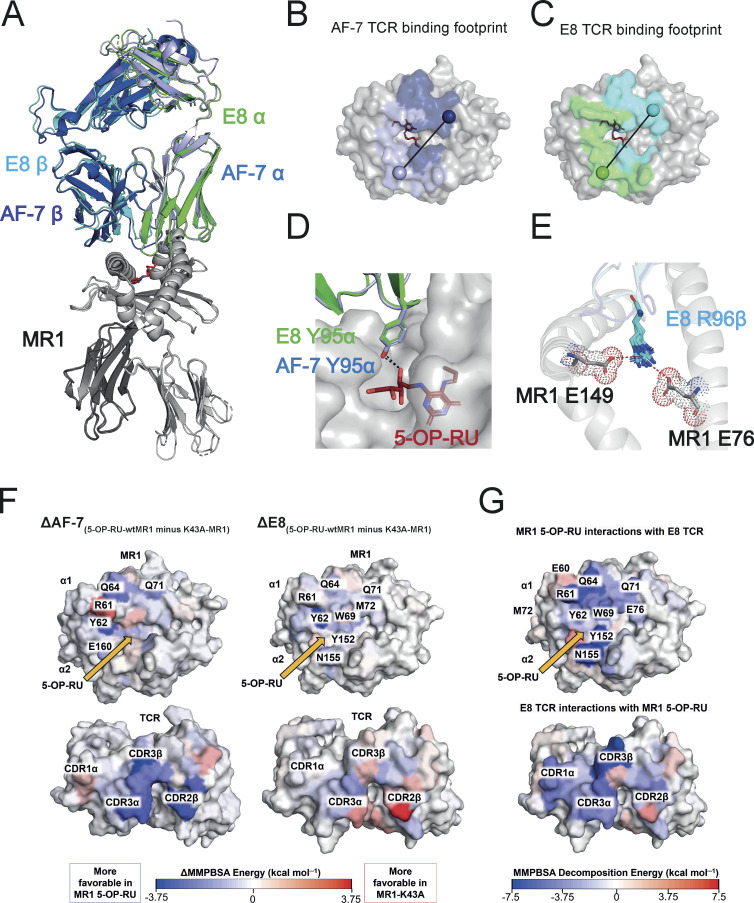
Figure 5.
Structural and energetic basis of promiscuous recognition of MR1 by the E8 TCR. (A) The structures of the E8 TCR (TRAV in green, TRBV in cyan) bound to MR1 loaded (in gray) with 5-OP-RU (shown as red sticks) aligned to the AF-7 TCR (TRAV in light blue and TRBV in dark Blue) bound to MR1 5-OP-RU (PDB 6PUC; Awad et al., 2020). (B) Surface map of the MR1 binding footprint of the AF-7 TCR (α in light blue and β in dark blue) as in Awad et al. (2020). A vector is drawn connecting the disulfide in the α chain variable domain (light blue sphere) to the disulfide in the β chain variable domain (dark blue sphere). (C) Surface map of the MR1 binding footprint of the E8 TCR (α in green and β in cyan). A vector is drawn connecting the disulfide in the α chain variable domain (green sphere) to the disulfide in the β chain variable domain (cyan sphere). (D) The structures of the AF-7 CDR3α Y95 residue light (blue sticks) and E8 CDR3α Y95 residue (green sticks) showing polar interaction (dotted line) with 5-OP-RU (red sticks) bound to MR1 (gray; Awad et al., 2020). (E) Superimposed structures of the CDR3β R96 residue (cyan sticks) in E8 TCRs that form salt bridges to the residues E76 and E149 (gray sticks) in MR1 loaded with ligands (5-OP-RU, 6-FP, 3-F-SA, 5-F-SA, 3-F-BA, and 4-F-BA). (F) Calculated per-residue differences (5-OP-RU-wtMR1 minus K43A-MR1) in the binding free energy for both the AF-7 and E8 TCRs with (5-OP-RU-wtMR1) and without (K43A-MR1) 5-OP-RU bound to MR1. A blue residue is more favorable in the 5-OP-RU form, while a red residue is more favorable in the MR1-K43A form. Yellow arrows indicate the position of 5-OP-RU. (G) Calculated per-residue contributions to the binding free energy for the E8 TCR–MR1 complex with 5-OP-RU bound. The MR1 and TCR molecules are shown as surfaces and color mapped according to their MMPBSA calculated per residue decomposition energies. Color mapping goes from blue (favorable binding) to white (neutral) to red (unfavorable binding) as indicated by the color bar.

