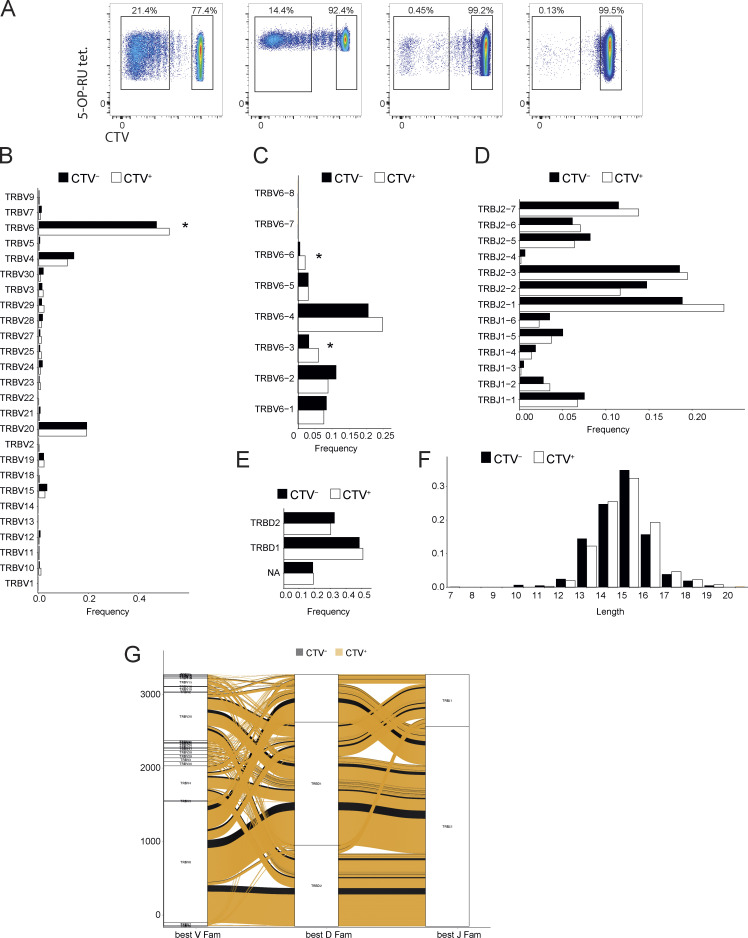
Figure S5.
Data relating to TCR usage. (A) Sorted 5-OP-RU tetramer+ cell populations that were used for bulk β-chain sequencing. (B) TRBV gene usage of CTV+ or CTV− MAIT cells. Statistical significance was determined using Fisher’s exact test, * P ≤ 0.05. (C) TRBV6 gene usage of CTV+ or CTV− cells. Statistical significance was determined using Fisher’s exact test, * P ≤ 0.05. (D) TRBJ6 usage of CTV+ or CTV− MAIT cells. (E) TRBD gene usage of CTV+ or CTV− MAIT cells. (F) Distribution of CDR3 lengths within either CTV+ or CTV− populations. (G) Alluvial plot or rearranged TCR genes in either CTV+ or CTV− MAIT cells.

