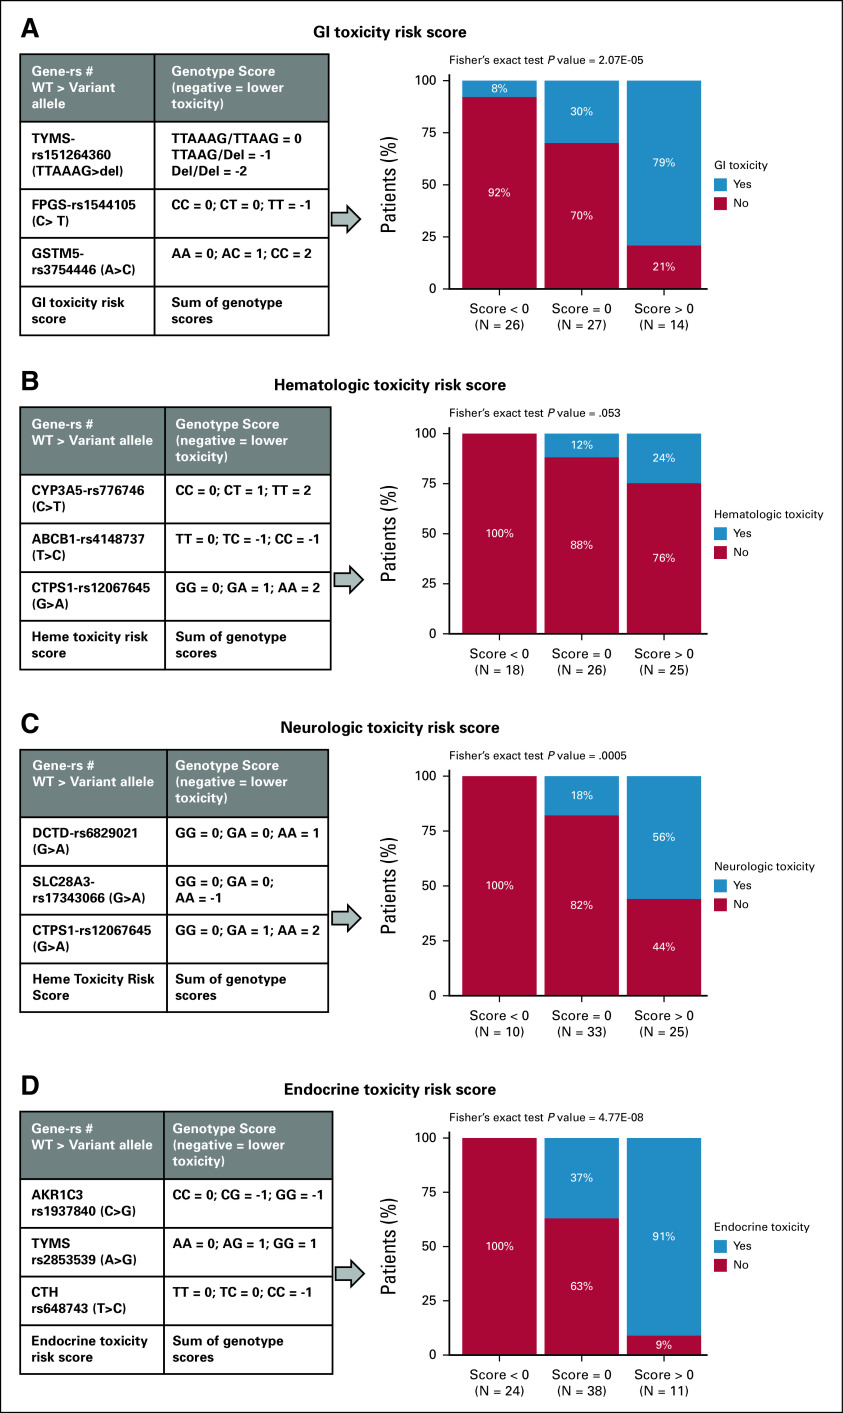
FIG 2.
Toxicity incidence by respective composite 3-SNP score groups within patients with ALL. Top model 3 SNPs that were used to create each toxicity SNP score and bar plot of score group versus incidence of toxicity is shown for (A) GI toxicity, n = 67, (B) hematologic toxicity, n = 71, (C) neurologic toxicity, n = 68, (D) and endocrine toxicity, n = 73. Toxicity risk score was computed just for patients with genotype data available for the 3 SNPs in the model. P values for Fisher's exact test are listed on top of each bar plot. GI, gastrointestinal; SNP, single-nucleotide polymorphism.

