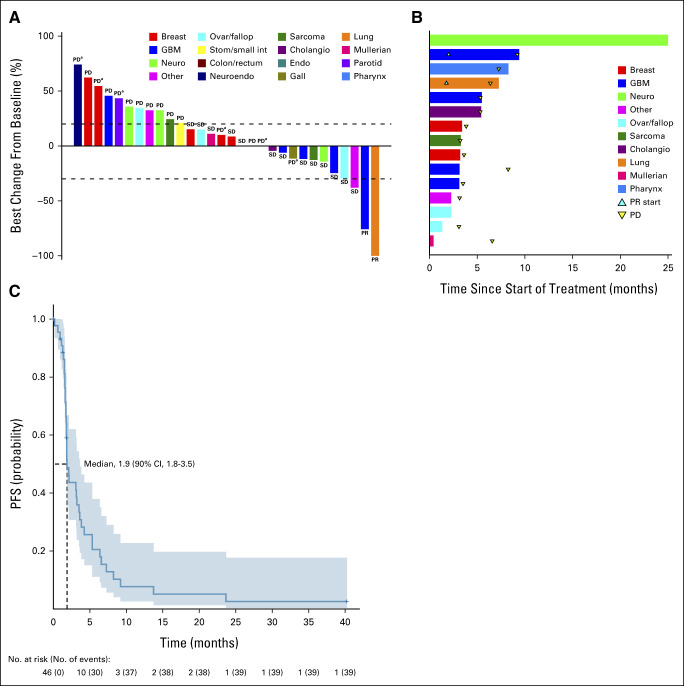
FIG 2.
Subprotocol 1 response and Kaplan-Meier curves for PFS. (A) Waterfall plot (N = 30) of best % change from baseline responses. This includes the 32 evaluable patients, excluding two patients who had a best response of PD with new lesions that had no recorded measurements. (B) Treatment duration in the 15 patients who achieved a best response of SD or PR. (C) Kaplan-Meier curve for PFS. aNew lesions. Cholangio, cholangiocarcinoma; endo, endocrine cancer; gall, gallbladder cancer; GBM, glioblastoma; neuro, peripheral nerve sheath tumor or neurofibroma; neuroendo, neuroendocrine carcinoma; ovar/fallop, ovarian/fallopian tube cancer; PD, progressive disease; PFS, progression-free survival; PR, partial response; stom/small int, gastric or small intestine carcinoma; SD, stable disease.

