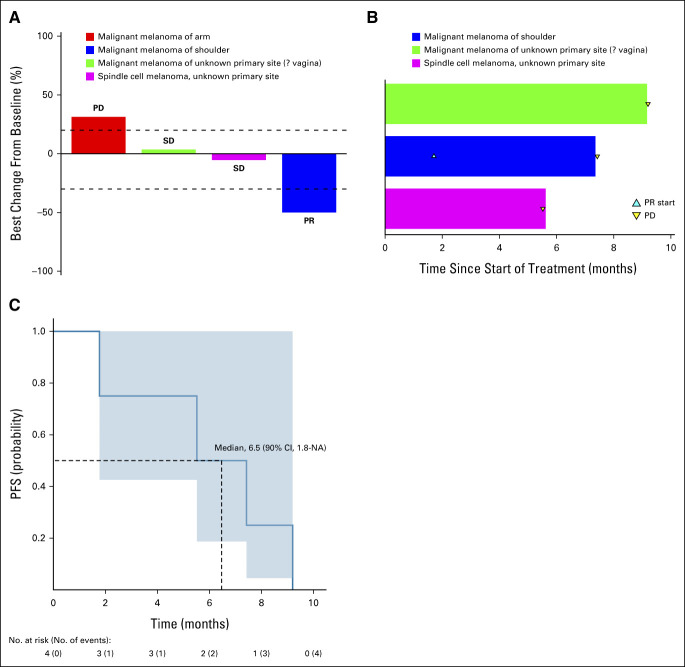
FIG 3.
Subprotocol 2 response and Kaplan-Meier curves for PFS. (A) Waterfall plot (N = 4) of best % change from baseline responses. (B) Treatment duration in the three patients who achieved a best response of SD or PR. (C) Kaplan-Meier curve for PFS. NA, not applicable; PD, progressive disease; PFS, progression-free survival; PR, partial response; SD, stable disease.

