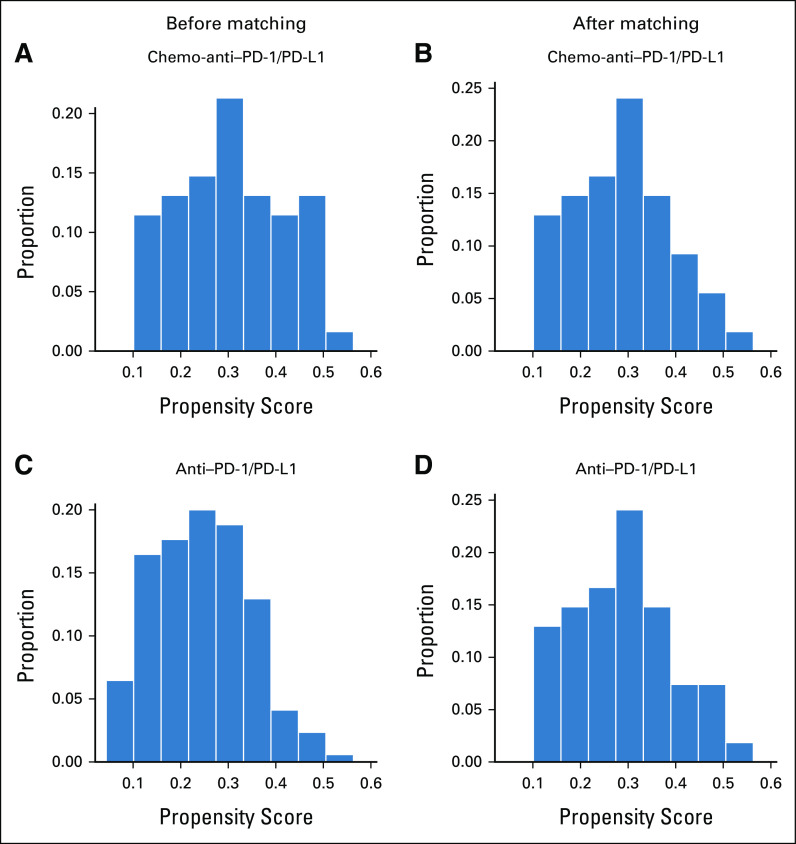
FIG A4.
Distribution of the propensity score between the chemo-anti-PD1/PD-L1 group and anti-PD1/PD-L1 group before and after matching. The histograms show the propensity score between (A-B) the chemo-anti-PD1/PD-L1 group and (C-D) anti-PD1/PD-L1 group before and after matching analysis. After propensity score matching, the distribution of the propensity score was improved, indicating that the two groups were well balanced.

