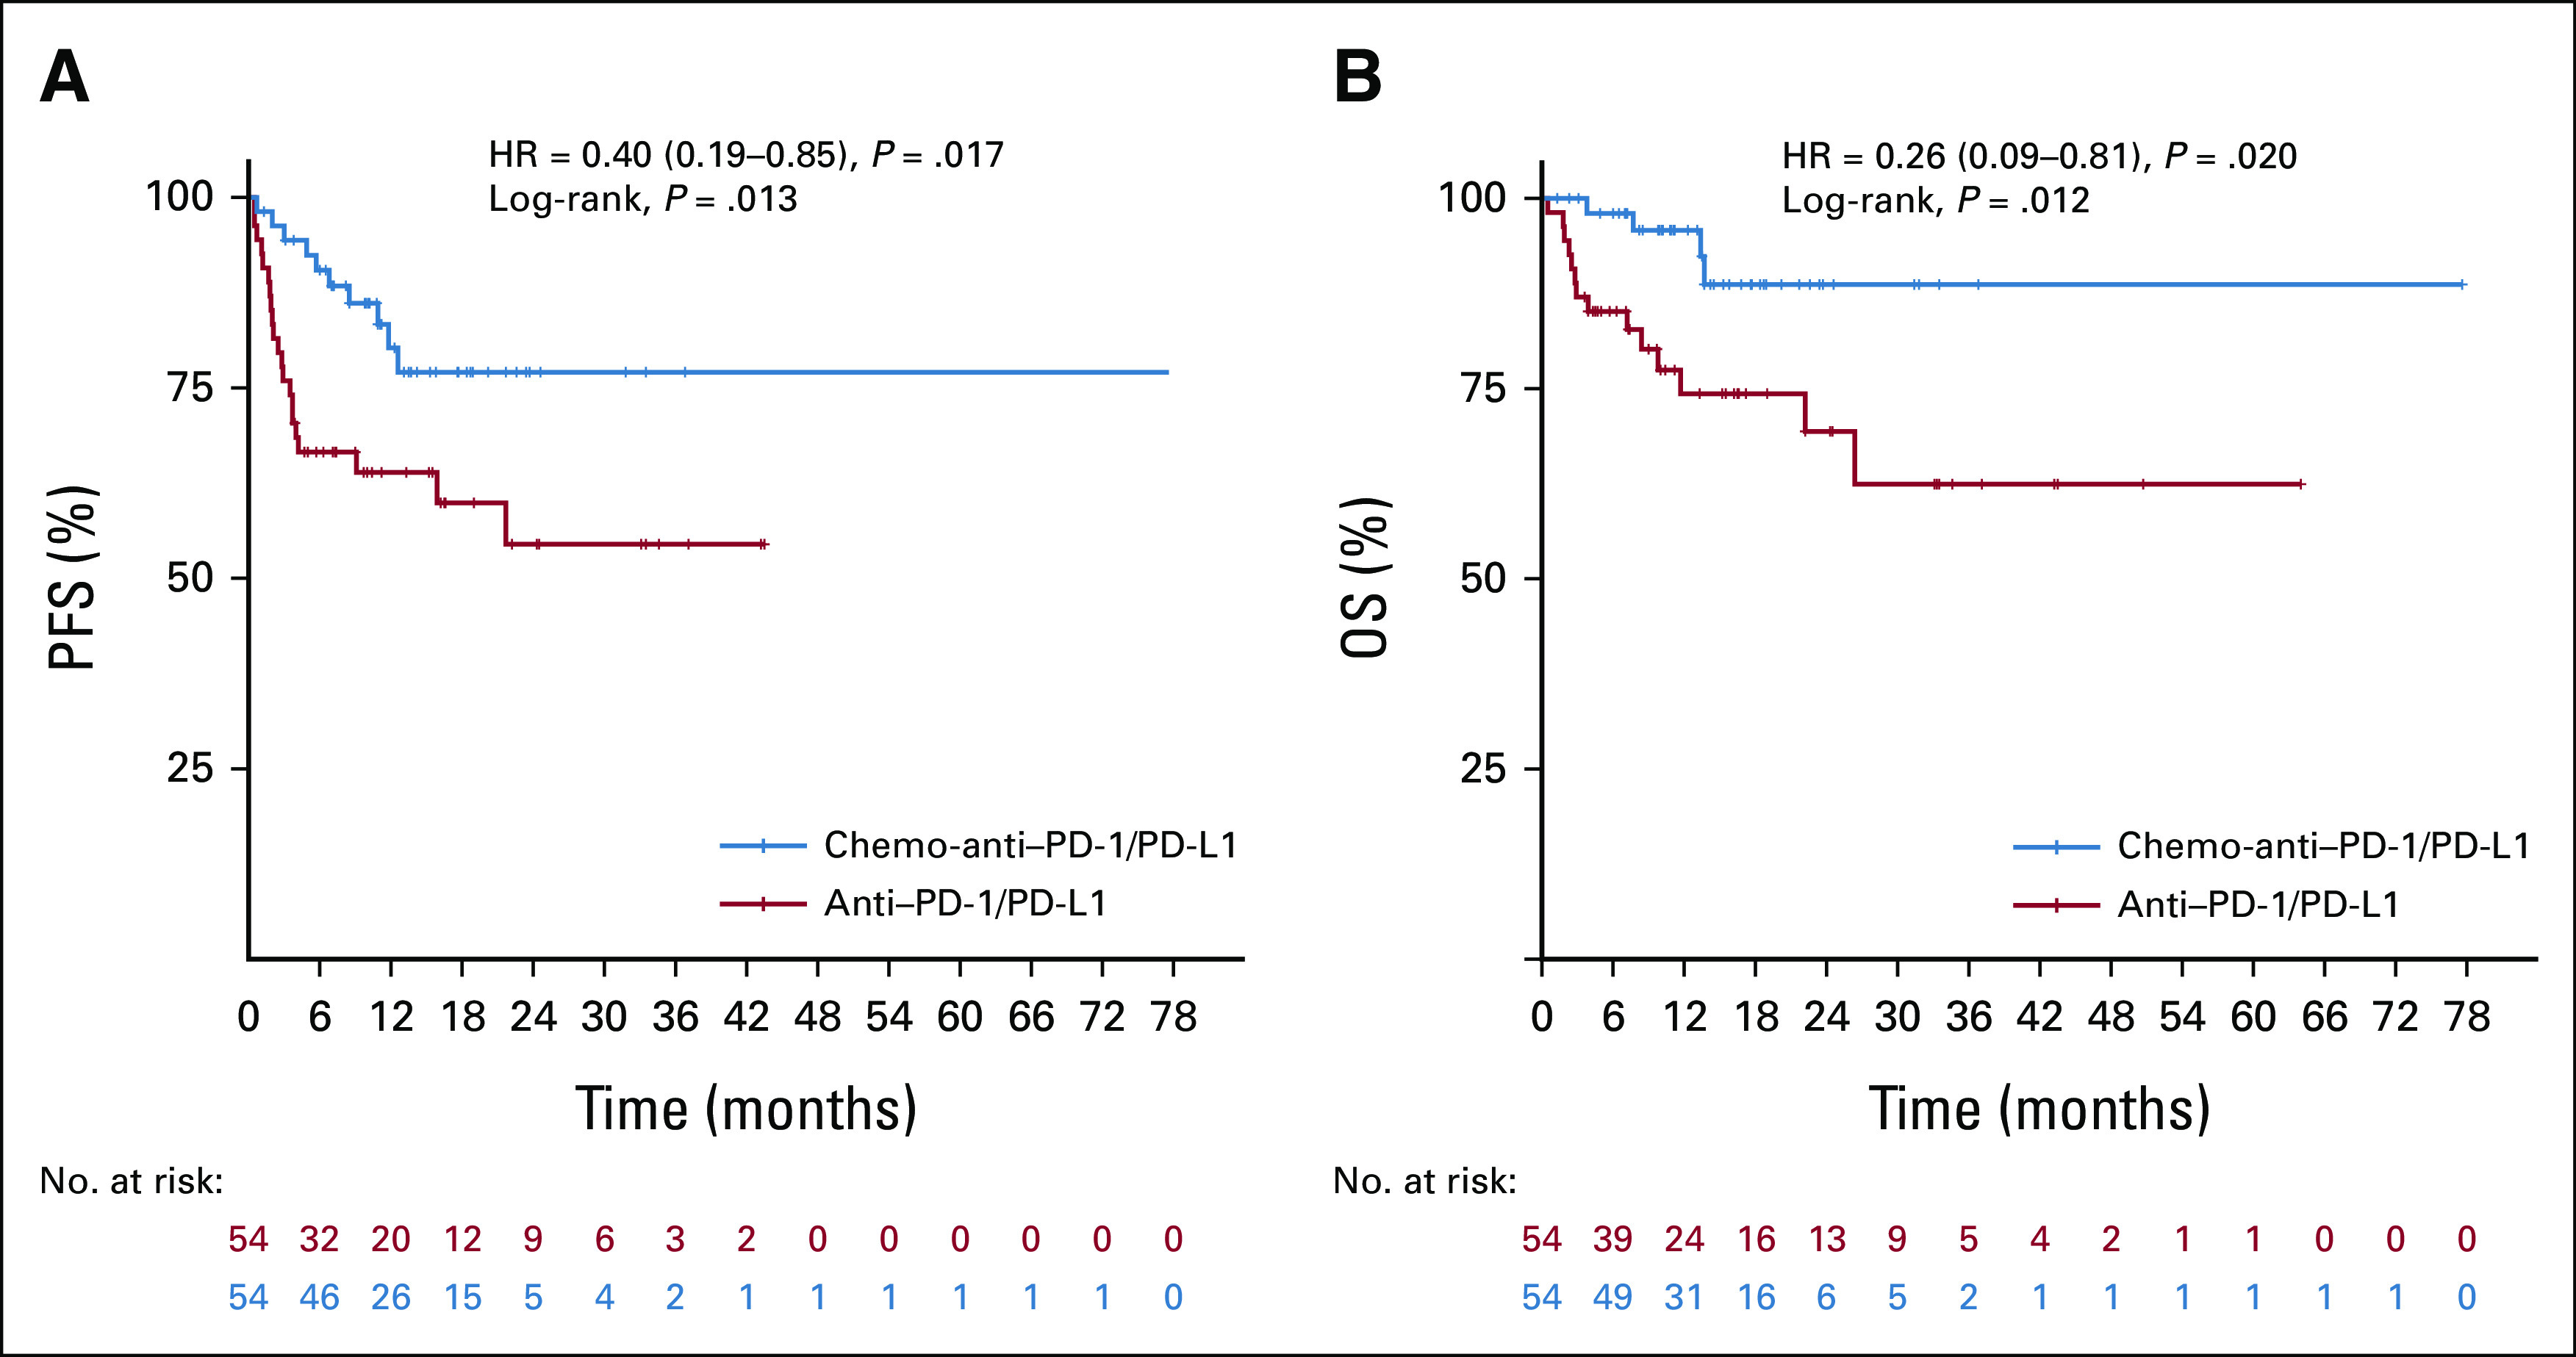
FIG A5.

Kaplan–Meier curves of PFS and OS for anti-PD1/PD-L1 group and chemo-anti-PD1/PD-L1 group in propensity score matching analysis. Shown are Kaplan–Meier curves of PFS (A) and OS (B) for MSI/dMMR gastrointestinal cancer patients in the anti-PD1/PD-L1 matched group and chemo-anti-PD1/PD-L1 matched group, respectively. Tick marks mean censored data. We performed a 1:1 nearest neighbor propensity score matching within the caliper width of 0.1. After propensity score matching analysis, PFS (P = .013) and OS (P = .012) were significantly longer in patients receiving chemo-anti-PD1/PD-L1 than in patients receiving anti-PD1/PD-L1. HR, hazard ratio; PFS, progression-free survival.
