
FIG 1.
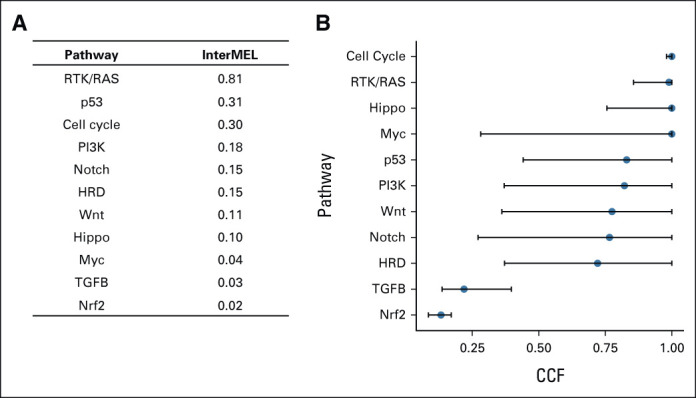
Oncogenic signaling pathway alteration in 495 stage II/III melanoma samples. (A) Pathway alteration frequency in the InterMEL cohort. (B) Pathway gene clonality. Median (blue dot) along with IQR (black line) of the estimated CCF across gene alterations within each pathway are plotted. CCF close to 1 indicates clonal events. CCF, cancer cell fraction; IQR, interquartile range.