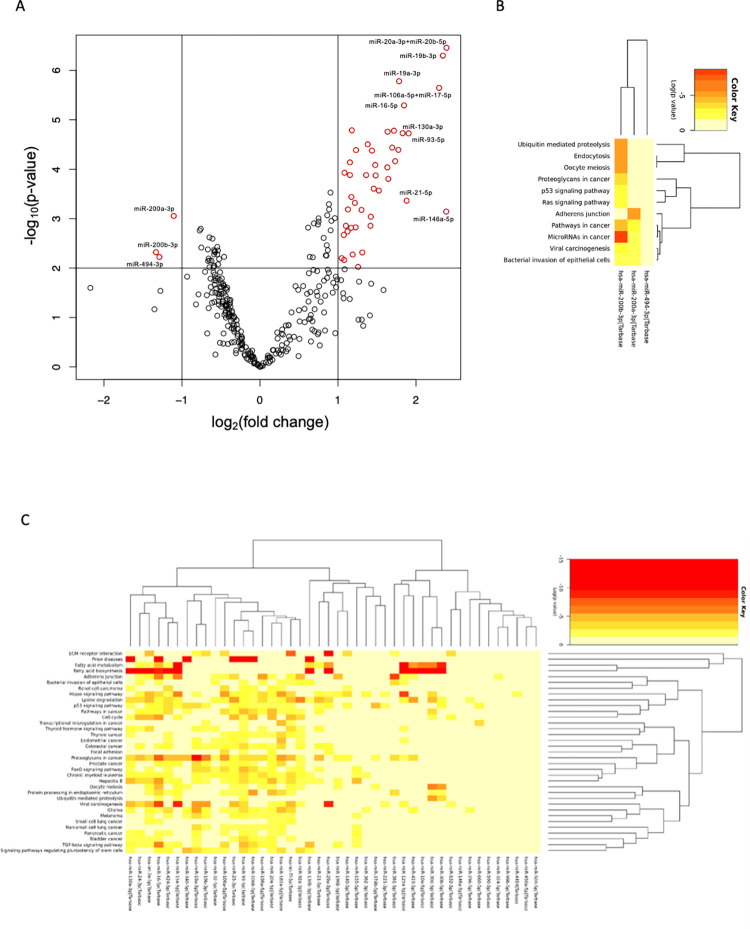
Fig 2. microRNA expression patterns in vulvar melanoma.
(A) Volcano plot of microRNAs in formalin fixed, paraffin embedded tissue from vulvar melanoma (n = 22) relative to primary cutaneous melanoma (n = 9) determined by NanoString (minimum 2-fold change, p-value <0.01). miRs with differential expression between groups deemed significant are displayed in red according to the log2 of the fold change in expression (x) and log10 of the p-value (y). miRs in black demonstrated non-significant differential expression between groups. (B-C) Pathway enrichment for differentially expressed miRs in vulvar melanoma based on interactions with validated target genes listed in the TarBase database (identified using DIANATools miRPath v.3). B. Heatmap depicting pathways enriched by miRs with significantly decreased expression in vulvar melanoma relative to primary cutaneous melanoma. C. Heatmap depicting pathways enriched by miRs with significantly increased expression in vulvar melanoma relative to primary cutaneous melanoma.

