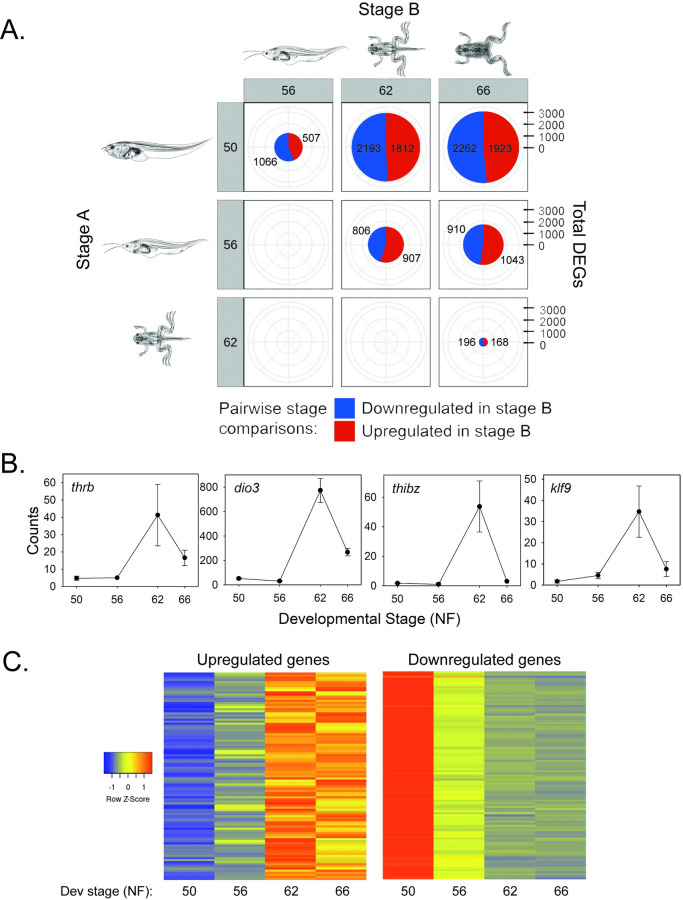
Fig 1. RNA-sequencing analysis in tadpole brain during metamorphosis.
A. Pie charts with pairwise comparisons of differentially expressed genes (DEGs) between four stages of metamorphosis. Numbers in red areas of the pie charts represent genes upregulated in Stage B, while the numbers in the blue areas of the pie charts represent genes downregulated in Stage B. Gene regulation changes increased as metamorphosis progressed, with roughly half the genes upregulated and half downregulated. Xenopus illustrations © Natalya Zahn (2022), source Xenbase (www.xenbase.org RRID:SCR_003280) [34]. B. Expression patterns of four known TH-regulated genes in tadpole brain (preoptic area/thalamus/hypothalamus) analyzed at four Nieuwkoop-Faber (NF) stages of spontaneous metamorphosis. Plotted are data from an RNA-seq experiment (n = 3/NF developmental stage). thrb–thyroid hormone receptor b; dio3 –monodiodinase type 3; thibz–thyroid hormone induced bZip protein; klf9 –Krüppel-like factor 9. All except dio3 have been shown to be directly regulated by TH-TR [35–39], which is also supported by the current TR ChIP-seq experiment. C. Heatmaps showing expression changes for the top 100 upregulated and the top 100 downregulated genes (determined during the developmental interval NF50-NF62; S1 Table).

