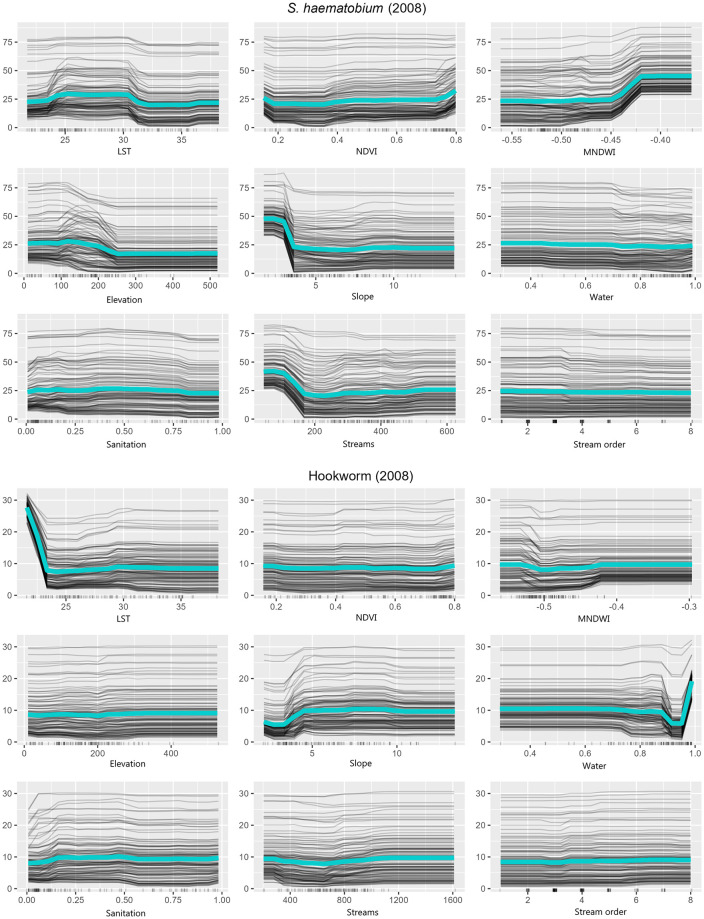
Fig 3. Partial dependence (teal) and individual conditional expectation (gray) plots show the marginal impact of each independent predictor variables (x-axis) on the dependent outcome variable (y-axis) while holding the other variables constant.
Only the best performing models were considered: 2 km buffer distance for S. haematobium and 3 km for hookworm for 2008 survey.

