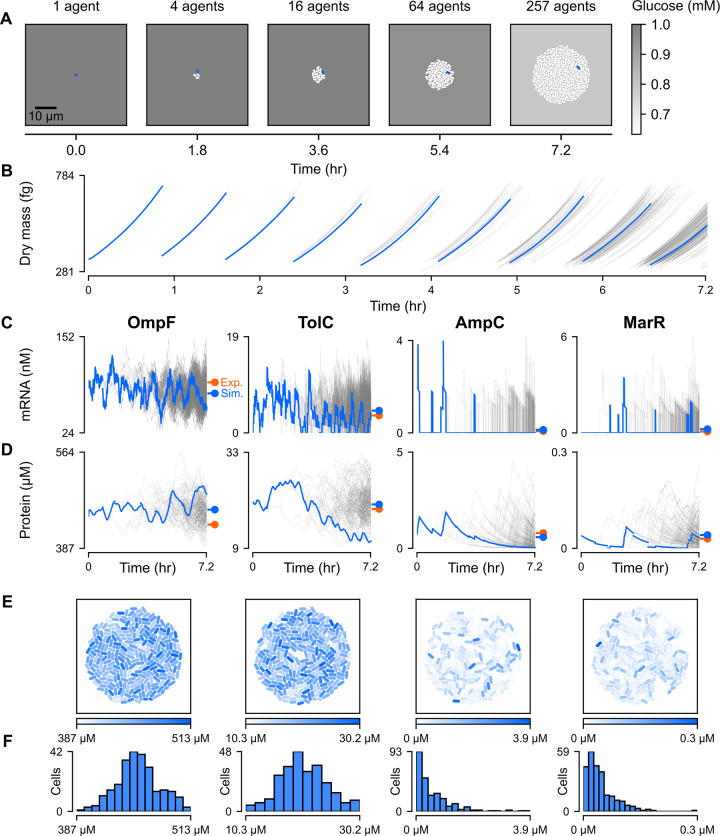
Fig 2. Spatio-temporal heterogeneity in baseline gene expression.
(A) Snapshots of a simulated E. coli colony. The environmental glucose concentration is represented as varying shades of gray. The blue-colored cells are from a single representative cell lineage (cell 011000000 and its ancestors) and the time series data for that same lineage is also highlighted blue in panels B, C, and D. (B) Dry mass in femtograms for each cell in the colony over time. The blue lines are from the lineage whose members are blue in the snapshots of panel A. (C-D) Time series plots of mRNA concentration placed above corresponding plots of monomer concentration (both in nanomolar) for four genes relevant to antibiotic resistance. The blue lines are from the lineage whose members are blue in panel A. Colored markers indicate the average protein [51] and mRNA [52] concentrations from real (orange) and simulated cells (blue). (E-F) Colony snapshots taken at the end of the simulation with monomer concentrations (column labels same as in panel C) depicted using varying shades of blue. A histogram of the concentration distributions for all cells in the final colony is placed below its corresponding snapshot. Note: All data shown is from a simulation run with seed 10000 for about 7.2 hours (26000 seconds) on minimal M9 medium supplemented with 1 mM glucose.

