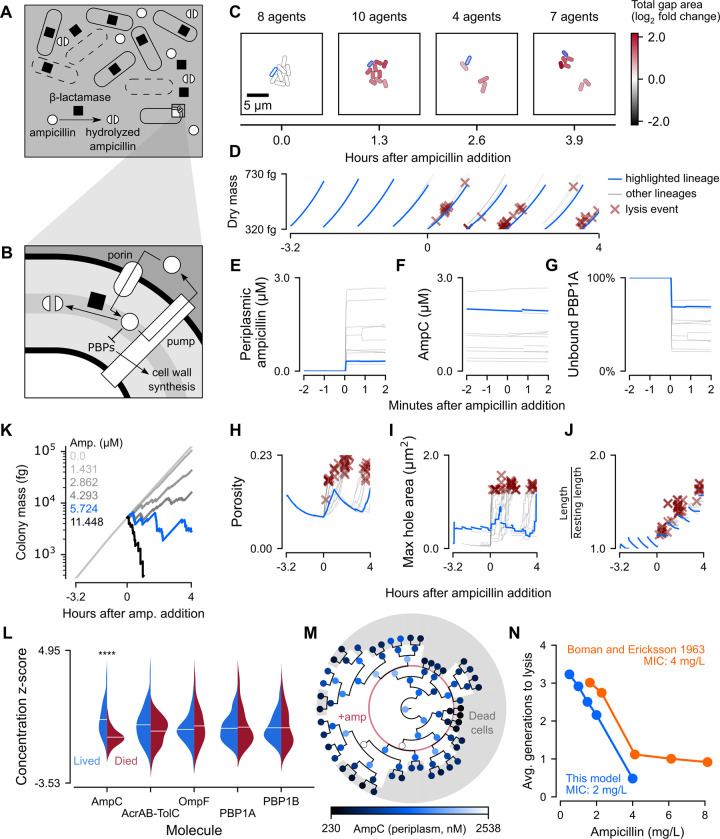
Fig 4. Spatio-temporal dynamics of response to ampicillin in E. coli colonies.
(A-B) Schematic of ampicillin hydrolysis and cell lysis at the colony scale and ampicillin transport and inhibition of cell wall synthesis at the cellular scale. (C) Snapshots of a representative colony simulation after addition of ampicillin at the MIC (2 mg/L). The color of each cell represents the log2 fold change of total gap area (area not covered by peptidoglycan) compared to the average total gap area for cells in a baseline glucose simulation. The cell lineage ending in cell 001111111 was outlined in blue and also plotted as blue traces in Panels D-J. (D) Per-cell dry mass starting with a single cell grown in M9 minimal medium with 1 mM glucose and no ampicillin for about 3.2 hours (11550 seconds), at which point ampicillin was added at the MIC and the simulation continued for approximately 4 more hours (14550 seconds). (E-G) Per-cell concentration of, from left to right, periplasmic ampicillin, AmpC beta-lactamase, and fraction of active PBP1A in the minutes surrounding tetracycline addition. (H-J) Per-cell concentration of, from left to right, cell wall porosity, maximum hole area, and cell wall stretch for the entire 7.2-hour (26000 seconds) simulation. (K) Whole colony mass for representative simulations run across six different concentrations of ampicillin (MIC in blue). The data from these simulations was also used to create Panel N. (L) Per-cell average concentrations of AmpC, AcrAB-TolC, OmpF, and PBP1A/B were normalized as z-scores and plotted as juxtaposed kernel density estimates, with red representing cells that died and blue representing cells that survived. Stars indicate statistical significance (p << 0.01). (M) Circular phylogenetic tree of cells colored by AmpC beta-lactamase concentration. Cells in the gray regions died and the red ring represents the time of ampicillin addition. (N) Average number of generations that dying cells were able to survive before lysis in five different concentrations of ampicillin (blue). Number of generations elapsed before seeing a decrease in optical density of a culture across several ampicillin concentrations (orange) [91]. Note: All data shown is from simulations run with seed 0 initialized with a snapshot 3.2 hours (11550 seconds) into a baseline glucose simulation (also seed 0) before being continued for an additional four hours (14550 seconds) with varying levels of external ampicillin.

