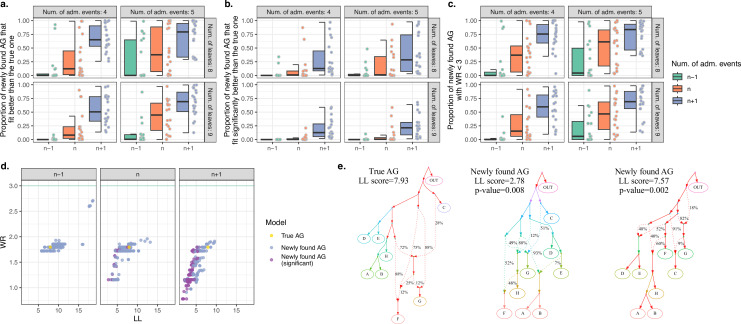
Figure 1. Computer simulations show that when the true admixture graph (AG) topology is complex, findGraphs frequently finds AGs fitting the data better than the true AG.
(a) Fractions of distinct AGs found with findGraphs that fit the data nominally better than the true AG (according to log-likelihood [LL] scores). The simulated datasets are grouped by complexity class (eight or nine leaves, four or five admixture events) and by the number of admixture events allowed at the topology search stage (n − 1 on the left, n in the middle, and n + 1 on the right, where n is the true number of simulated admixture events). Each dot represents a simulated random history, and 20 such histories were simulated for each complexity class. (b) Fractions of distinct AGs found with findGraphs that fit the data significantly better than the true AG (two-tailed empirical p-value of the bootstrap model comparison method <0.05). (c) Fractions of distinct AGs found with findGraphs that fit the data well in absolute terms (WR < 3 SE). (d) Distinct AGs found for a particular simulated history (eight groups and four admixture events) in the LL and WR coordinates. Only best-fitting graphs with WR < 3 SE are shown. The fit of the true topology is shown in yellow, and topologies that fit the data significantly better than the true one are in purple. The true topology was not recovered by our findGraphs searches. (e) The true model from panel (d) and two alternative models found with findGraphs, both fitting significantly better than the true one (based on the bootstrap p-value) and very different topologically. This is presented as an example of very high topological diversity seen among well-fitting models. Model parameters (graph edges) that were inferred to be unidentifiable (see Appendix 1, Section 2.F) are plotted in red.

