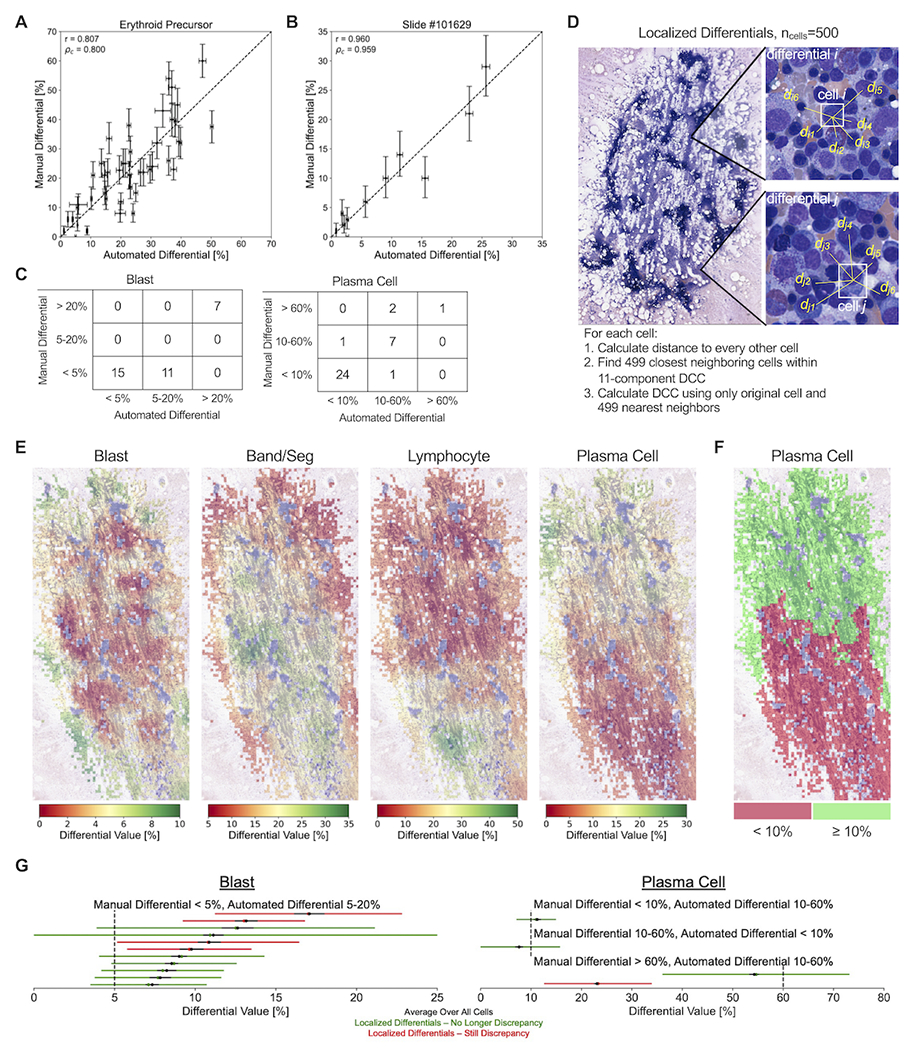
Figure 5. Assessment of intra-slide variance in DCC values.

(A) Correlation plot comparing erythroid precursor differential values between manual and automated DCCs, with vertical and horizontal error bars represent the statistically expected variability in manual and automated differential values, respectively, based on the number of cells identified from the manual and automated methods. Each point represents one of 44 testing slides. Dotted line represents a 1:1 correlation between manual and automated values. r: Pearson correlation coefficient between manual and automated values. ρc: concordance correlation coefficient between manual and automated values, representing how well points are fitted by the 1:1 correlation line. (B) Correlation plot comparing the percentage of 11 different cell types between manual and automated DCCs, with vertical and horizontal error bars represent the statistically expected variability in manual and automated differential values, respectively, based on the number of cells identified from the manual and automated methods. Each point represents one of 44 testing slides. Dotted line represents a 1:1 correlation between manual and automated values. (C) 3x3 contingency tables for the number of slides with manual and automated DCC values below and above clinically-relevant thresholds, excluding slides with statistically expected variance overlapping with threshold values. (D) Diagram demonstrating the calculation of 500-cell localized differentials using each individual cell and their 499 nearest neighboring cells. (E) Visualization of the localized variability in DCC values across different optimal regions of an example BMA smear. For each cell, a localized 500-cell differential is calculated among the cell and its 499 nearest neighbors, and differential values are averaged across all cells located within an individual optimal tile. Optimal tiles are colored based on average tile values for a particular cell type. (F) Thresholding of localized DCC plasma cell values at the 10% diagnostic threshold for plasma cell neoplasms. (G) Intra-slide variability in localized differential values for (left) blast cells and (right) plasma cells among the 15 BMA slides with discrepancies between manual and automated values identified in Figure 5C. Each BMA slide is represented by a horizontal line. Black dot and line represent the mean value and statistically expected variability, respectively, in automated differential values when averaging across all cells. Green/red dot and line represent the mean value and 95% confidence interval, respectively, in localized differential values. BMA slides that no longer demonstrate a discrepancy between manual and automated values across the diagnostic threshold when taking into account intra-slide variability are shown in green; those that still demonstrate discrepancies are shown in red.
