
Figure 2:
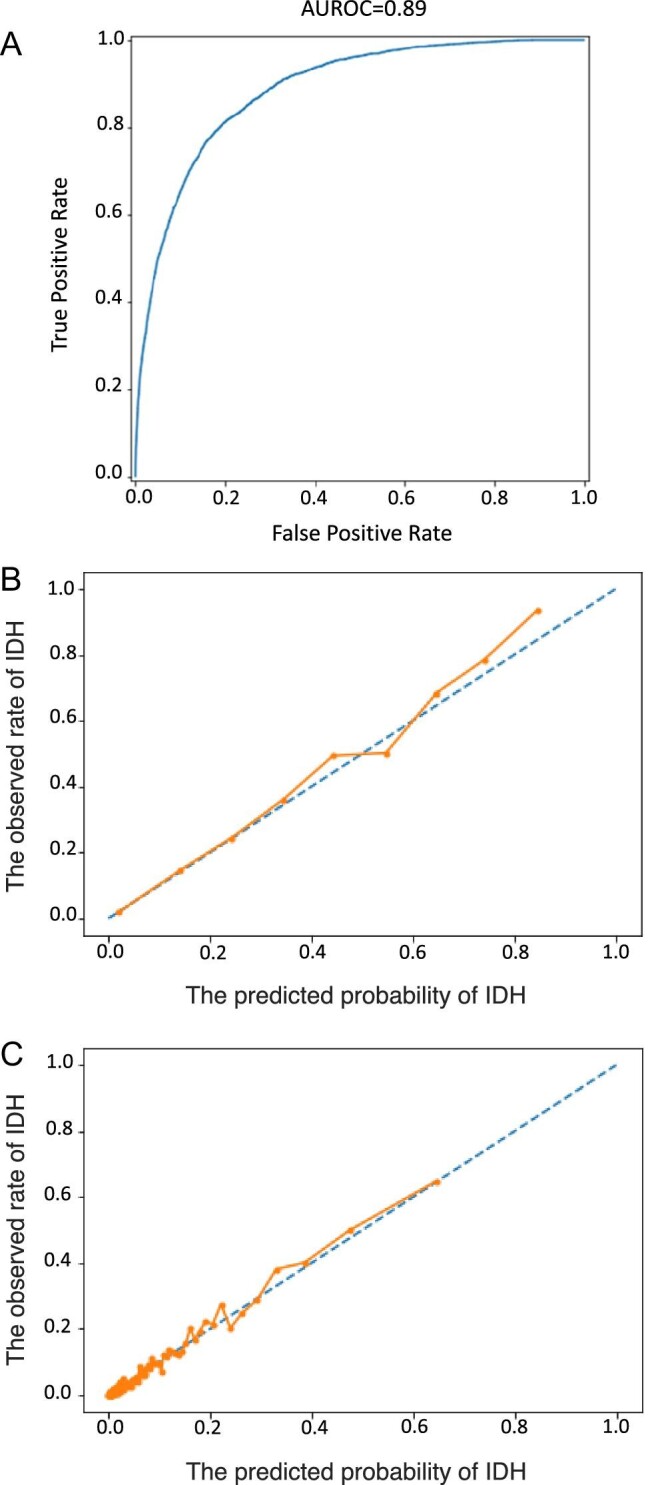
(A) AUROC. The true positive rate is shown on the y-axis, equal to sensitivity. The false positive rate on the x-axis is calculated as 1 – specificity. The 95% CIs of the AUROC are 0.881–0.892. (B) Calibration plot with equal bin width. Probability calibration plot shows the predicted probability against observed events. (C) Calibration plot with equal number of samples per bin (200 bins in total). Here, instead of equal bin-width, we set the bin width based on the number of samples to account for the data distribution (most probabilities are under 0.5).