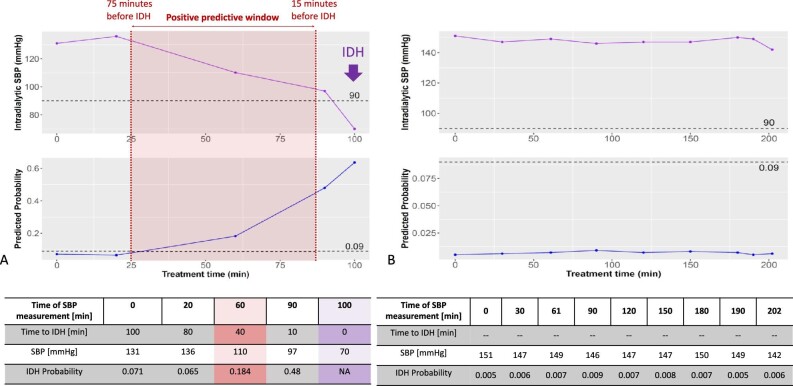
Figure 4:
Two examples demonstrating a patient with (A; left panel) and without (B; right panel) IDH. (A) An example of SBP (top row) and IDH probability (bottom row) in a patient who experienced IDH. The model predicted the probability of IDH throughout HD with each SBP measurement (approximately every 30 min during a regular HD treatment); the model was trained to predict IDH 15–75 min before the event. An IDH probability ≥0.09 was set as IDH alert threshold (dashed horizonal lines in the lower panels). Data after the IDH event were not considered. (B) An example of SBP and predicted IDH probability in a patient who did not experience IDH; the IDH probability remained below the IDH alert threshold throughout the treatment.

