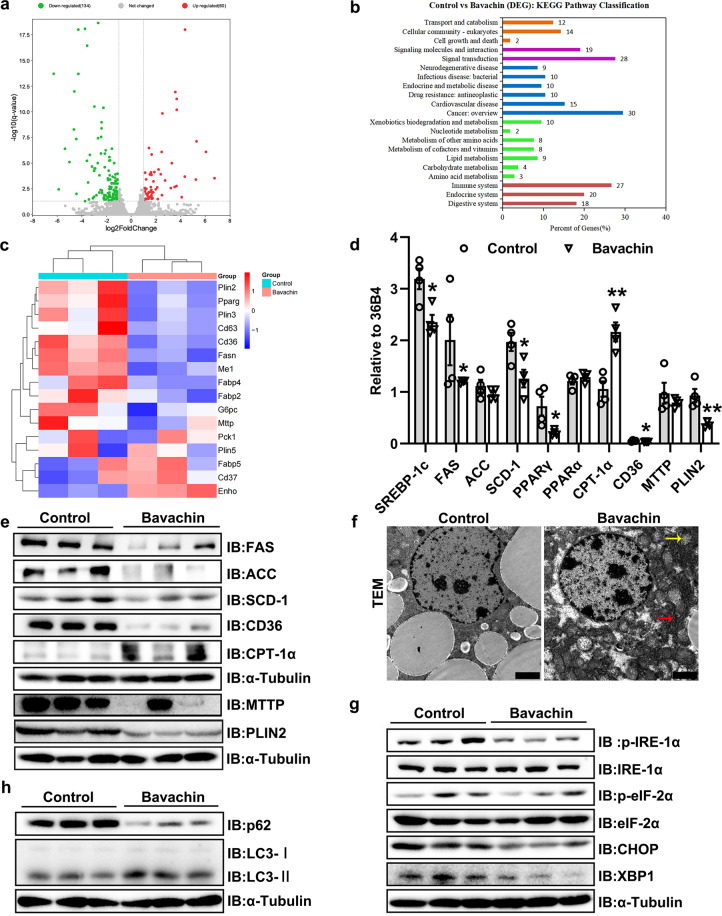
Fig. 4. Bavachin represses the hepatic lipogenesis in HFD-induced mice.
a Scatterplot of differentially expressed genes identified by RNA-seq in the livers of 20 weeks HFD-fed mice with or without bavachin treatment. b KEGG pathway analysis showing the involved pathways of DEGs identified by RNA-seq. c Heatmap showing the expression of genes involved in hepatic lipid metabolism on RNA-seq. qPCR (d) and Western blot (e) analysis of genes involved in lipogenesis, fatty acid oxidation, and transport in the livers of control and bavachin-treated mice after 20 weeks of HFD. f Transmission EM observation of the hepatic microstructure, yellow arrows indicate the mitochondria, red arrows indicate the endoplasmic reticulum; scale bars, 2 μm. g Western blot analysis of proteins involved in ER stress in the livers of control and bavachin-treated mice after 20 weeks of HFD. h Western blot analysis of proteins involved in autophagy in the livers of control and bavachin-treated mice after 20 weeks of HFD. Data are presented as the mean ± SEM; *P < 0.05, **P < 0.01, ***P < 0.001 by Student’s t-test.

