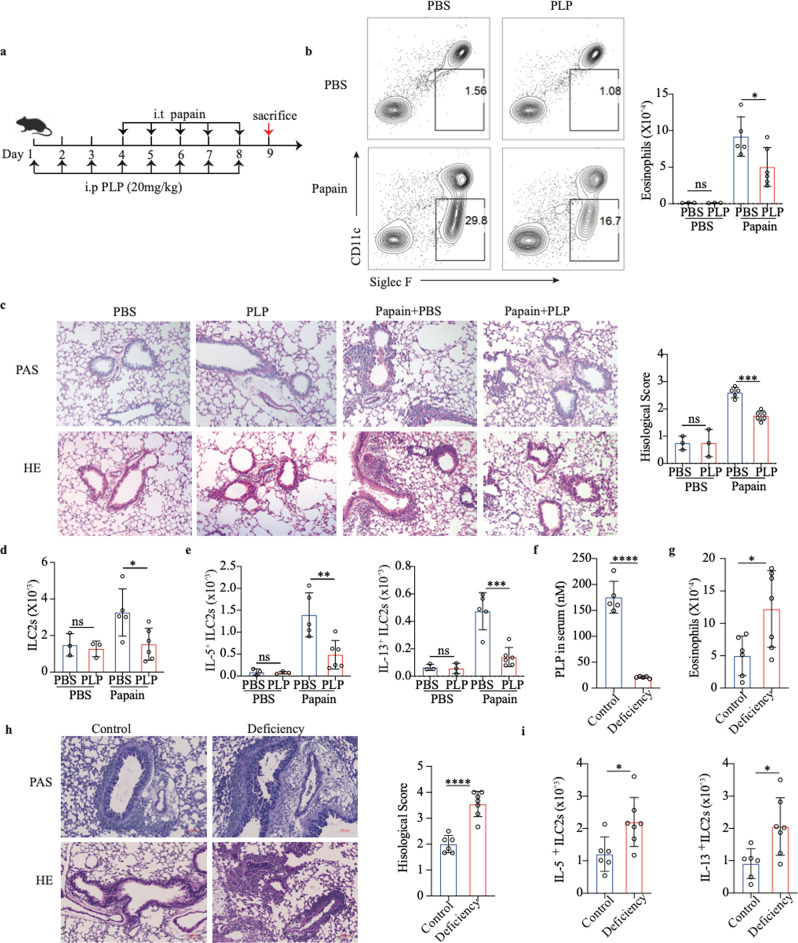
Fig. 2.
Vitamin B6 ameliorates papain-induced acute lung inflammation. a Schematic diagram of PLP treatment by intraperitoneal (i.p.) delivery in a papain model of lung inflammation in C57BL/6J mice. b Representative flow cytometry analysis and quantification of eosinophils (CD45+SiglecF+CD11c−) in BALF. c Representative images of H&E- and PAS-stained lung sections and semiquantified inflammation of lungs from PBS- or PLP intraperitoneally treated mice (scale bar, 50 µm). d Total number of lung CD45+Lin−CD90.2+ST2+ ILC2s as assessed by flow cytometry. e Quantification of IL-5+ ILC2s and IL-13+ ILC2s by flow cytometry in the lungs of control and PBS- or PLP-treated mice in the papain model. (In b–e, PBS-treated group, n = 3; papain-treated group, n = 5/6) f LC‒MS analysis of serum PLP levels in vitamin B6 control diet- (n = 5) and vitamin B6-deficient diet-fed mice (n = 5). g Number of eosinophils (CD45+ SiglecF + CD11c−) in BALF according to flow analysis from vitamin B6 control diet- and vitamin B6-deficient diet-treated mice in the papain model (n = 6/7). h Representative images of H&E- and PAS-stained lung sections and semiquantified inflammation of lungs from vitamin B6 control diet- and vitamin B6-deficient diet-fed mice in the papain model (n = 6/7) (scale bar, 100 µm). i Numbers of functional ILC2s (IL-5+ ILC2s, IL-13+ ILC2s) in the lungs as determined by flow analysis (n = 6/7). The data are shown as the means ± SDs (error bars) of three independent experiments. The data were analyzed by one-way ANOVA with Dunnett’s multiple comparison test (b‒e) and unpaired Student’s t test (f–i). *p < 0.05; **p < 0.01; ***p < 0.001; ****p < 0.0001

