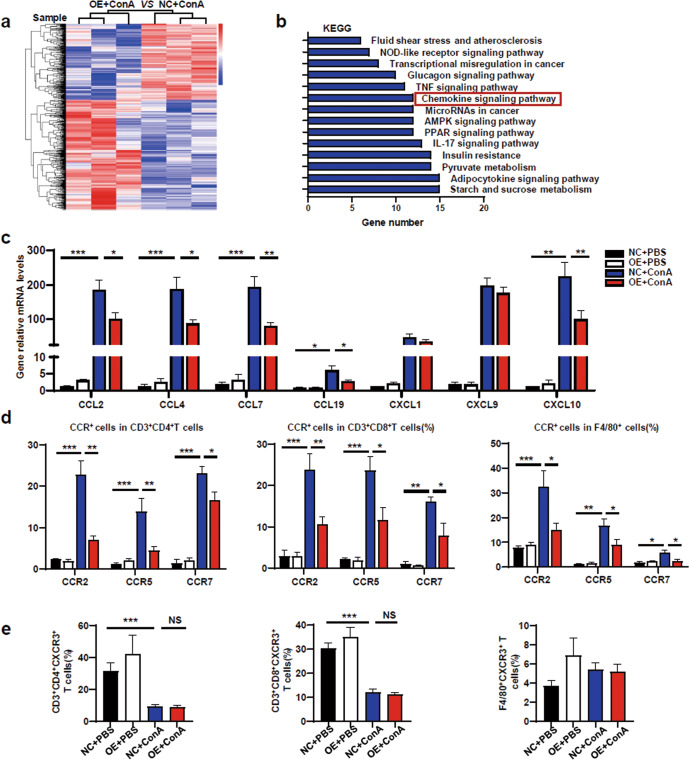
Fig. 6. METRNL-mediated suppression of liver inflammation was chemokine‑dependent.
aHierarchical clustering of differentially expressed genes (DEGs) in the NC + ConA and OE + ConA groups were analysed, and gene expression profiles are shown in the heatmap (n = 3 per group). b The DEGs of each pair were subjected to KEGG analysis, and the top 14 annotations enriched in biological functional pathways are shown (FC ≥ 2, P ≤ 0.05, n = 3 per group). c The mRNA levels of the hepatic chemokines CCL2, CCL4, CCL7, CCL19, CXCL1, CXCL9 and CXCL10 in NC and OE mice treated with PBS or Con A were analysed. d The levels of CCR2, CCR5, and CCR7 in CD4+ T cells, CD8+ T cells and F4/80+ cells derived from livers were assessed by flow cytometry. e The levels of CXCR3 in CD4+ T cells, CD8+ T cells and F4/80+ cells derived from livers were assessed by flow cytometry. n = 4–6 per group. The data are presented as the mean±SEM and were analysed by one-way ANOVA. *P < 0.05, **P < 0.01, ***P < 0.001.

