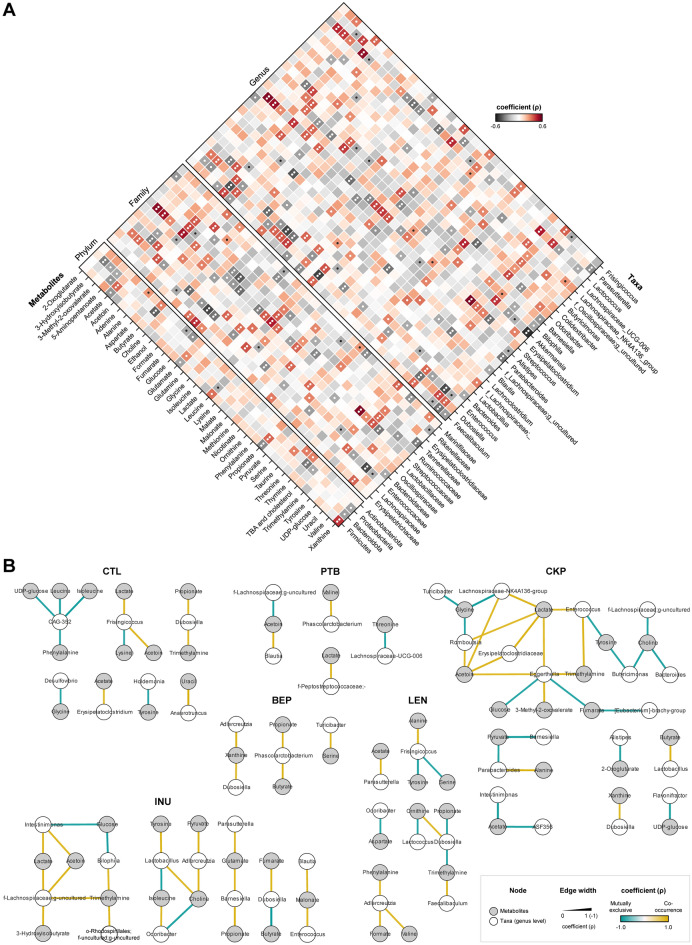
Figure 3.
Integrated multi-omics analyses reveal modulations in microbiome-metabolome correlation networks specific to resistant starches from different dietary pulses. Microbiome-metabolome correlation of dietary fiber (resistant starch or inulin) relative to standard western-style diet group. (A) Correlation of gut metabolites with the major bacterial phyla, families and genera (*P < 0.05; **P < 0.01). (B) Microbiome-metabolome correlation network based on Spearman’s rank correlation coefficients. Each node represents one genus (white) or metabolite (gray); two nodes are linked if the correlation coefficient value is > 0.85 and P (FDR-corrected) is < 0.01. CTL: control western-style diet group; PTB pinto beans, BEP black-eyed peas, LEN lentils, INU inulin.

