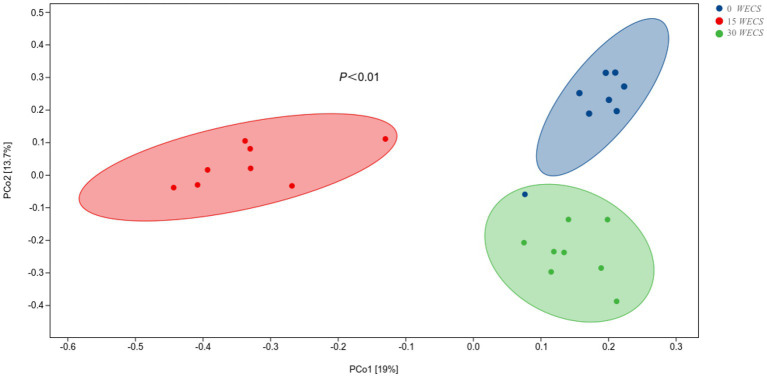
Figure 4.
Principal coordinate analysis (PCoA) on community structures of the cecal microbiota after silage corn treatment (n = 8), 0 WECS control group, 15 WECS 15% whole-plant ensiled corn stalks +85% concentrate feed, 30 WECS 30% whole-plant ensiled corn stalks +70% concentrate feed. Each point in the figure represents a sample, and different colored points indicate different groupings. The percentages in the brackets on the axes represent the proportion of the sample difference data (the distance matrix) that can be explained by the corresponding axes.

