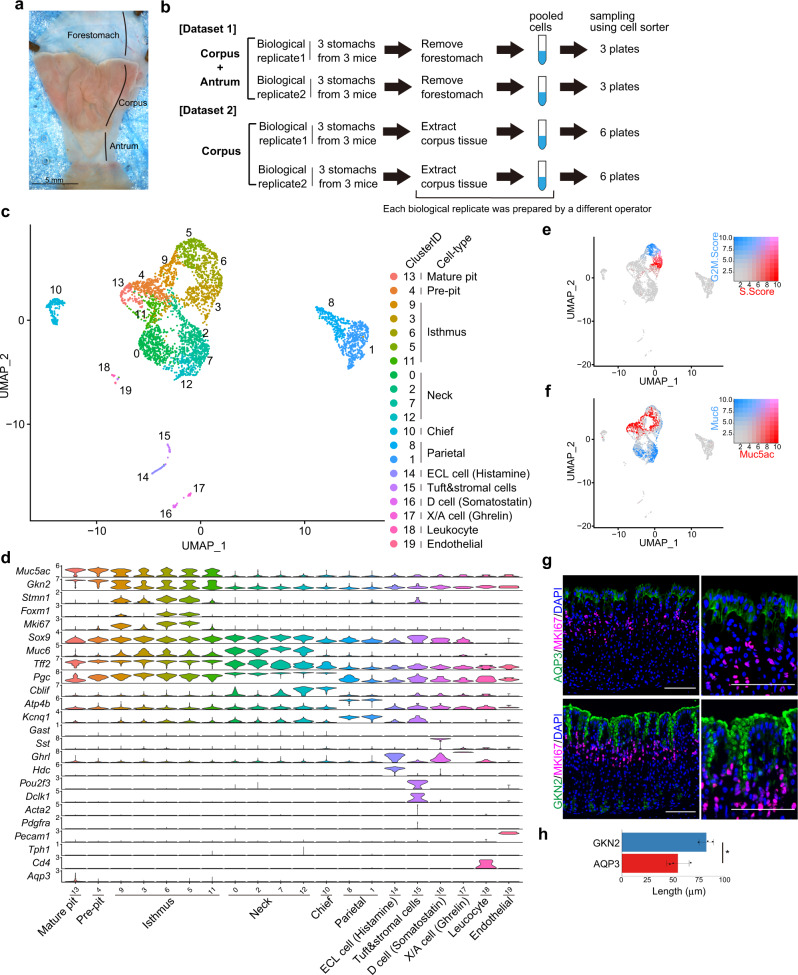
Fig. 1. Single-cell analysis of adult mouse corpus gastric units.
a Luminal surface of adult mouse stomach tissue. Scale bar, 5 mm. b Schematic of the experimental design. Cells prepared from the corpus and antrum were analyzed in dataset 1, and cells prepared from the corpus were analyzed in dataset 2. In each dataset, two biological replicates from three mice were prepared by two different operators. Each biological replicate was sorted into three or six plates in datasets 1 and 2, respectively. c UMAP visualization of the cells isolated from adult mouse corpus gastric units (dataset 2). Cells are colored according to the clustering results. d Violin plots showing the expression of known marker genes in each cluster. e, f UMAP of gastric cells colored by the score of cell cycle-state (S-phase and G2/M-phase) (e) and the expression levels for Muc5ac and Muc6 (f). g Immunofluorescence staining of adult mouse corpus gastric units with a mature pit cell marker AQP3 (green), a pan pit cell marker GKN2 (green), an isthmus progenitor cell marker MKI67 (red), and DAPI (blue). Scale bar, 100 µm. h Bar graph showing the lengths of GKN2+ and AQP3+ regions along each gastric unit in (g). Each data point represents the mean value of at least 10 gastric units. Data are presented as mean values ± standard deviation (SD; n = 3 mice). Statistical information: significance was calculated by two-tailed Student’s t-tests. *p = 0.0230. Source data are provided as a Source Data file.

