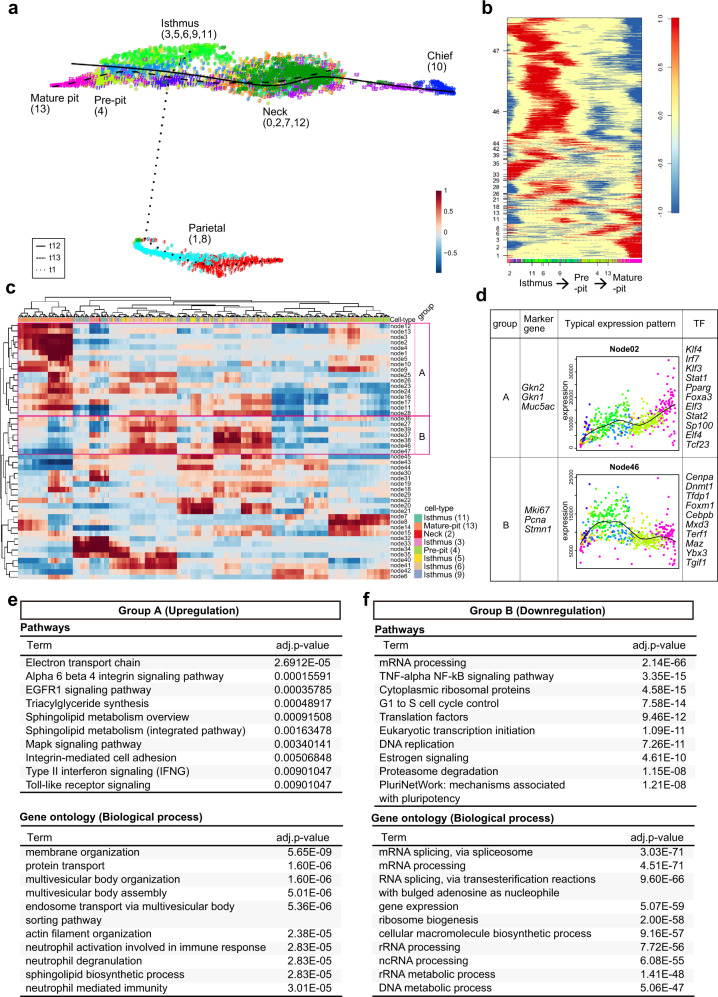
Fig. 2. Characterization of the pit cell differentiation process.
a Pseudotemporal ordering of pit cells, isthmus progenitor cells, neck cells, and parietal cells identified in dataset 2. Principal curves are shown for mature pit cells (t13, heavy dotted line), neck cells (t12, solid line), and parietal cells (t1, fine dotted line). b Self-organizing map of binarized pseudotemporal expression profiles along the pit cell differentiation trajectory. The x-axis indicates the cells involved in the pit cell lineage that are colored according to cell types, and the y-axis indicates the nodes. c Hierarchical clustering of co-expression nodes in (b). The nodes in groups A and B show upregulation and downregulation patterns of the genes in the pit cell differentiation trajectory, respectively. The x-axis indicates the cells involved in the pit cell lineage that are colored according to cell types, and the y-axis indicates the nodes. The x-axis in (c) is not the same as that of (b) due to the hierarchical clustering of the cells. The colors for each cell type are shown in the bottom right corner. d Characteristics of groups A and B identified in (c). Marker genes in each group were shown. Average pseudotemporal expression profile of the representative node is indicated by a black line. The x-axis indicates pseudotime from isthmus progenitor cells to pit cells, and the y-axis indicates expression level. Colors in each dot represent cell types, which correspond to colors used in (a). Among the TFs involved in groups A and B, the top 10 TFs specifically expressed in pit cells and isthmus progenitor cells (LogFC > 0.25) are shown here, respectively. e, f Characterization of the pseudotime-dependent genes included in group A (e) and group B (f). Upper panel, pathway enrichment analysis of the pseudotime-dependent genes. The top ten pathways with significant enrichment (adjusted p-value < 0.05) are listed. Lower panel, GO analysis of the pseudotime-dependent genes. The top ten terms with significant enrichment (adjusted p-value < 0.05) are listed. Adjusted p-value was determined using one-tailed Fisher’s exact test with g:SCS method in g:Profiler36 (pathways) and Fisher’s exact test with Benjamini–Hochberg adjustment in Enrichr37 (GO).

