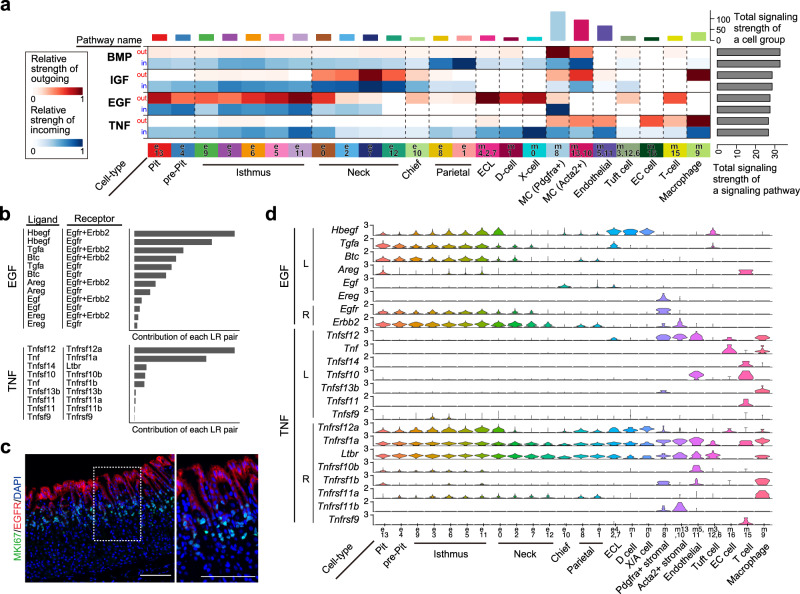
Fig. 3. Analysis of signaling pathways and ligand-receptor interactions across gastric cell types.
a CellChat-based analysis of outgoing and incoming signaling in each cell type. The x-axis indicates cell types, and the y-axis indicates signaling pathways. For each signaling, the outgoing signal intensity is shown in red (upper row), and the incoming signal intensity is shown in blue (lower row). b Relative contribution of EGF and TNF ligand-receptor pairs calculated by CellChat. c Immunofluorescence staining of adult mouse corpus tissues with EGFR (red), MKI67 (green), and DAPI (blue). Scale bar, 100 μm. Inset shows high-magnification image of boxed area. The image is representative of three independent experiments. d Expression of EGF and TNF ligands and receptors across gastric cell types.

