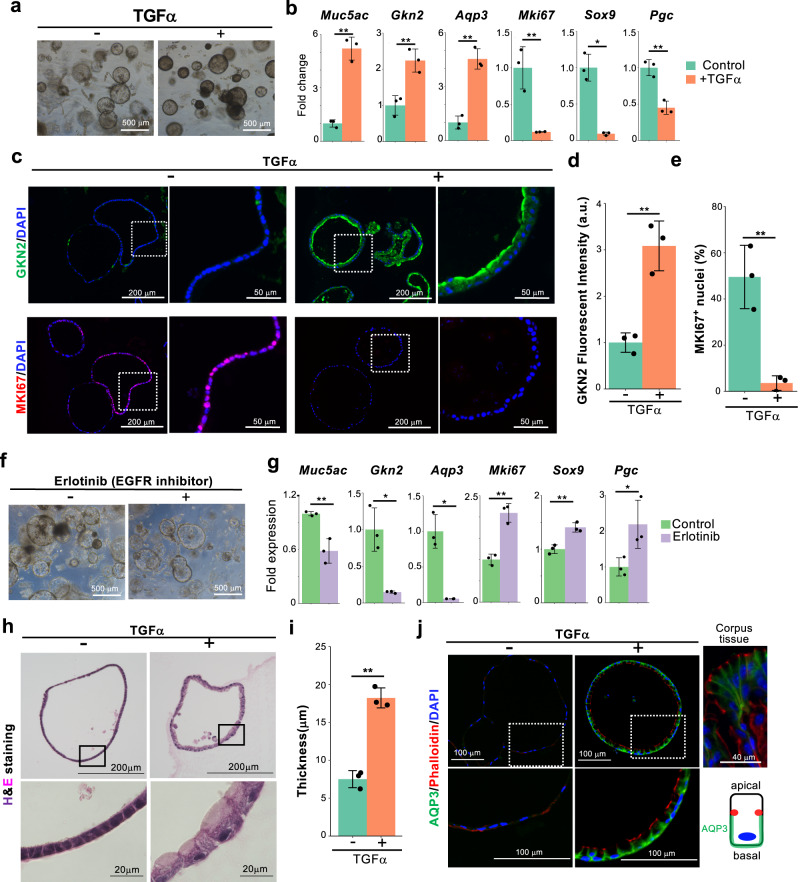
Fig. 4. TGFα promotes pit cell differentiation.
a Corpus organoids cultured with or without TGFα for 6 days. The images are representative of three biologically independent samples. b qPCR analysis of gastric epithelial cell marker expression in the corpus organoids in (a). Data are presented as mean ± SD (n = 3 biologically independent samples). c Immunofluorescence staining of corpus organoids in (a) with GKN2 (green), MKI67 (red), and DAPI (blue). High-magnification images of the dotted squares are shown on the right side. d Quantification of GKN2 fluorescence intensity in (c). Each data point represents a mean value of six pictures from three biologically independent samples. Data are presented as mean ± SD. **p = 0.0033. e Quantification of the percentage of MKI67+ cells in all DAPI+ cells in (c). Each data point represents the mean value of three pictures from three biologically independent samples. Data are presented as mean values ± SD. **p = 0.0048. f Corpus organoids treated with or without an EGFR inhibitor, erlotinib (0.5 µM). g qPCR analysis of gastric epithelial cell marker expression in the organoids in (f). Data are presented as mean ± SD (n = 3 biologically independent samples). h H&E staining of the organoids cultured with or without TGFα. High-magnification images of the squares are shown in the lower panels. i Quantification of the thickness of epithelial cells in the organoids in (h). Each data point represents the mean value of three pictures from three biologically independent samples. Data are presented as mean ± SD. **p = 0.0004. j Immunofluorescence staining of AQP3, phalloidin, and DAPI in corpus organoids cultured with or without TGFα. High-magnification images of the dotted squares are shown in the lower panels. Right upper panel, immunostaining of adult mouse corpus tissue. The lower right cartoon illustrates the location of AQP3 and phalloidin in the pit cell. The images are representative of three independent experiments. Source data are provided as a Source Data file. Significance was calculated by two-tailed Student’s t-tests for samples with equal variances or two-sided Welch’s t-tests for samples with unequal variances. *p < 0.05; **p < 0.01.

