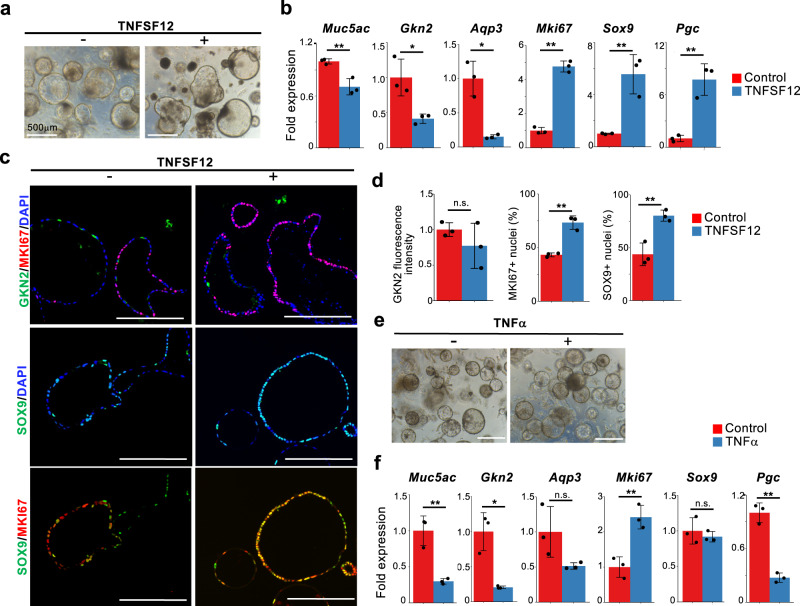
Fig. 5. TNFSF12 and TNF maintain isthmus progenitor cells in the undifferentiated state.
a Corpus organoids cultured in the presence or absence of 100 ng/mL TNFSF12 for 6 days. b qPCR analysis of gastric epithelial cell marker expression in gastric organoids in (a). Data are presented as mean fold changes ± SD (n = 3 biologically independent samples). **p = 0.0068 for Muc5ac; *p = 0.0197 for Gkn2; *p = 0.0271 for Aqp3; **p < 0.0001 for Mki67; **p = 0.00463 for Sox9; **p = 0.0032 for Pgc. c Immunofluorescence staining of corpus organoids in (a) with GKN2 (green), SOX9 (green), MKI67 (red), and DAPI (blue). Scale bar, 200 µm. d Quantification of GKN2 fluorescence intensity and percentage of nuclear MKI67+ and SOX9+ in all DAPI+ cells of the gastric organoids in (c). Each data point represents the mean value of ten organoids. Data are presented as mean fold changes ± SD (n = 3 biologically independent samples). **p = 0.0013 for MKI67+ nuclei; **p = 0.0060 for SOX9+ nuclei. e Corpus organoids cultured in the presence or absence of 100 ng/mL TNFα. Scale bar, 500 µm. f qPCR analysis of gastric epithelial cell marker expression in the gastric organoids in (e). Data are presented as mean fold changes ± SD (n = 3 biologically independent samples). **p = 0.0042 for Muc5ac; *p = 0.0369 for Gkn2; **p = 0.0058 for Mki67; **p = 0.0005 for Pgc. Source data are provided as a Source Data file. Significance was calculated by two-tailed Student’s t-tests for samples with equal variances or two-sided Welch’s t-tests for samples with unequal variances. *p < 0.05; **p < 0.01; n.s. (not significant). Data of the control samples are also presented in Fig. 4b.

