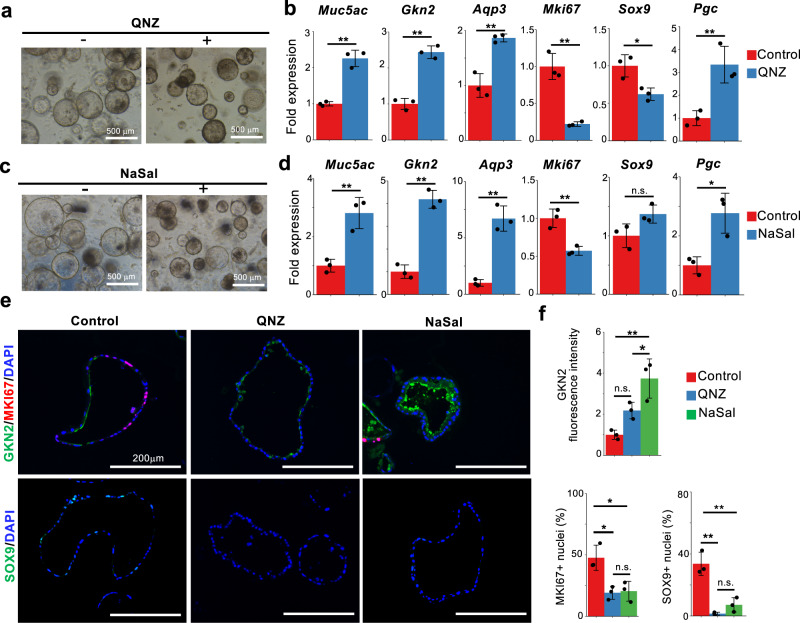
Fig. 6. NF-κB inhibition induces pit cell differentiation.
a Corpus organoids cultured in the presence or absence of a NF-κB inhibitor, QNZ (16 nM). b qPCR analysis of gastric epithelial cell marker expression in gastric organoids in (a). Data are presented as mean fold changes ± SD (n = 3 biologically independent samples). **p = 0.0007 for Muc5ac; **p = 0.0004 for Gkn2; **p = 0.0027 for Aqp3; **p = 0.0016 for Mki67; *p = 0.0182 for Sox9; **p = 0.0094 for Pgc. c Corpus organoids cultured in the presence or absence of an NF-κB inhibitor, NaSal (1.25 mM). d qPCR analysis of gastric epithelial cell marker expression in gastric organoids in (c). Data are presented as mean fold changes ± SD (n = 3 biologically independent samples). **p = 0.0056 for Muc5ac; **p = 0.0003 for Gkn2; **p = 0.0010 for Aqp3; **p = 0.0054 for Mki67; *p = 0.0141 for Pgc. e Immunofluorescence staining of corpus organoids with GKN2 (green), MKI67 (red), SOX9 (green), and DAPI (blue). The corpus organoids were cultured with or without QNZ or NaSal. Scale bar, 200 µm. f Quantification of GKN2 fluorescence intensity and the percentage of MKI67+ and SOX9+ cells in the gastric organoids in (e). Each data point represents the mean value of at least ten organoids from three biologically independent samples. Data are presented as mean fold changes ± SD. NaSal vs Control **p = 0.0037, QNZ vs Control n.s., QNZ vs NaSal *p = 0.0473 for GKN2 fluorescence intensity; *p = 0.0150, *p = 0.0121, n.s. for MKI67+ nuclei; **p = 0.0017, **p = 0.0006, n.s. for SOX9+ nuclei. Source data are provided as a Source Data file. Significance was calculated by two-tailed Student’s t-tests for samples with equal variances or two-sided Welch’s t-tests for samples with unequal variances in (b) and (d); significance was determined by one-way ANOVA followed by Tukey’s test in (f). *p < 0.05; **p < 0.01; n.s. not significant.

