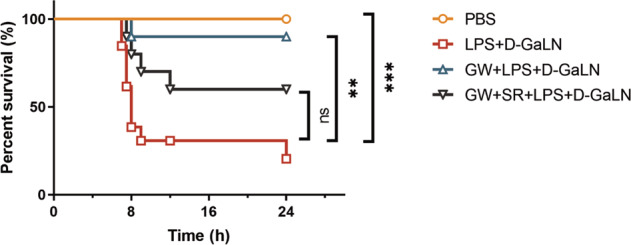
Fig. 1. Survival analysis of grouped mice.

Kaplan-Meier survival curves of BALB/C mice (n = 8, 13,10, 10 for group with PBS, D-GalN +LPS, GW + D-GalN +LPS, and GW + SR + D-GalN +LPS treatment respectively). (ns, P > 0.05; **P < 0.01; ***P < 0.001)

Kaplan-Meier survival curves of BALB/C mice (n = 8, 13,10, 10 for group with PBS, D-GalN +LPS, GW + D-GalN +LPS, and GW + SR + D-GalN +LPS treatment respectively). (ns, P > 0.05; **P < 0.01; ***P < 0.001)