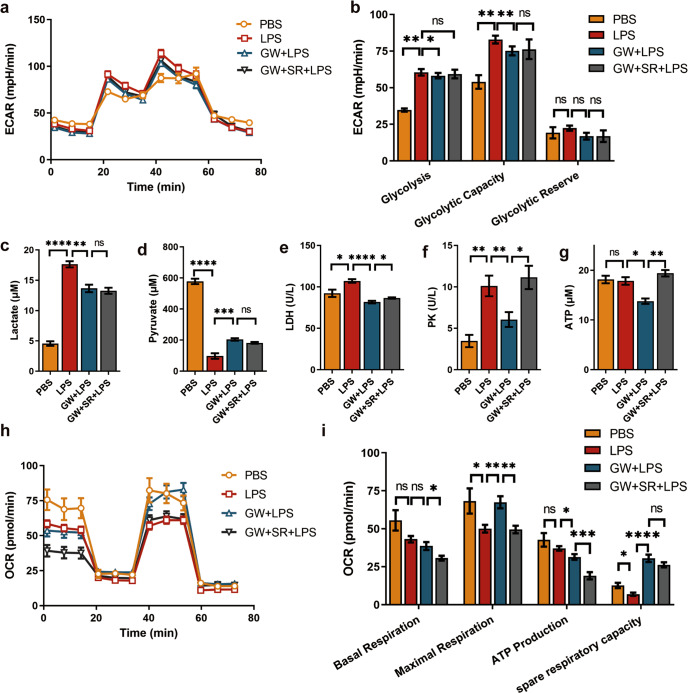
Fig. 5. Effect of CB2R activation on glucose metabolism in LPS-activated macrophages.
a ECAR at each point, b Glycolysis parameters of glycolysis stress test (n = 6 for each group). c Lactate, d Pyruvate concentration was detected in grouped treatment cell supernatant (n = 5 for each group). e LDH (n = 4), and f PK (n = 5) activity of grouped treatment cells were detected. g ATP production of grouped treatment cells (n = 3). h OCR at each point, i Aerobic respiration parameters of mitochondrial stress test of grouped treatment RAW264.7 cell (n = 6 for each group). (ns, P > 0.05; *P < 0.05; **P < 0.01; ***P < 0.001; ****P < 0.0001)

