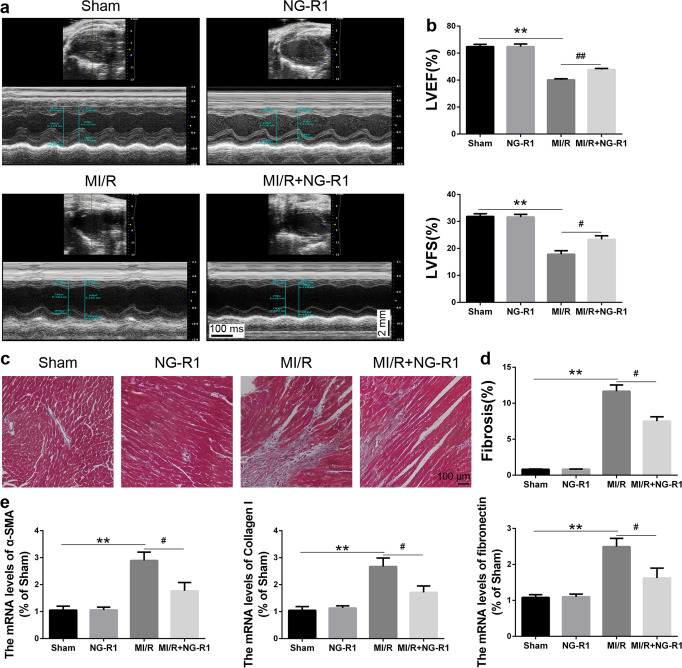
Fig. 2. NG-R1 prevents MI/R injury-induced cardiac remodeling and dysfunction.
a Representative images of M-mode echocardiography in each group. b Quantitative echocardiographic analysis of left ventricular ejection fraction (LVEF) and left ventricular fractional shortening (LVFS). c, d Representative images of Masson trichrome-stained MI/R hearts and quantification of the fibrosis area (%). Scale bar = 100 µm. e Quantitative reverse transcription polymerase chain reaction analysis of α-SMA, collagen I and fibronectin. The data are represented as the mean ± SEM (n = 6 for each group). **P < 0.01 vs. the Sham group. #P < 0.05 and ##P < 0.01 vs. the MI/R group.

