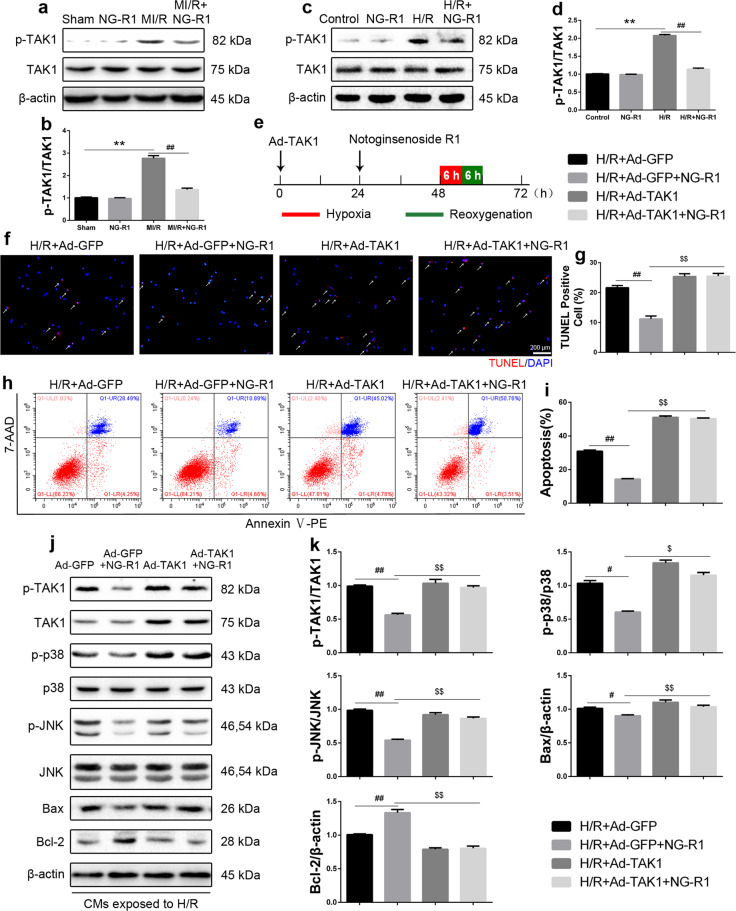
Fig. 6. TAK1 overexpression reversed the antiapoptotic effect of NG-R1 on CMs.
a Western blot analysis of phosphorylated and total TAK1 protein levels in ischemic myocardial tissue 4 h after perfusion. β-actin served as a loading control. b Quantitative analysis of a. c Western blot analysis of phosphorylated and total TAK1 protein levels in vitro. d Quantitative analysis of c. e Schematic illustration of TAK1 adenoviral infection. The TAK1 overexpression adenoviral vector or control GFP adenovirus (20 MOI) was used to infect CMs 48 h before H/R injury. f Immunofluorescence staining of TUNEL-positive cells. Scale bar = 200 µm. g Quantitative analysis of f. h Representative images of apoptosis, as determined by PE-7-AAD/Annexin V staining. I Statistical analysis of apoptosis in the four groups. j The expression levels of p-TAK1, TAK1, p-p38, p38, p-JNK, JNK, Bcl-2 and Bax were determined by Western blotting. k Quantitative analysis of j. The data are shown as the mean ± SEM (n = 6 for each group). **P < 0.01 vs. the Sham group or the Control group. #P < 0.05 and ##P < 0.01 vs. the MI/R group, the H/R group or the H/R + Ad-GFP group. $P < 0.05 and $$P < 0.01 vs. The H/R + Ad-GFP + NG-R1 group.

