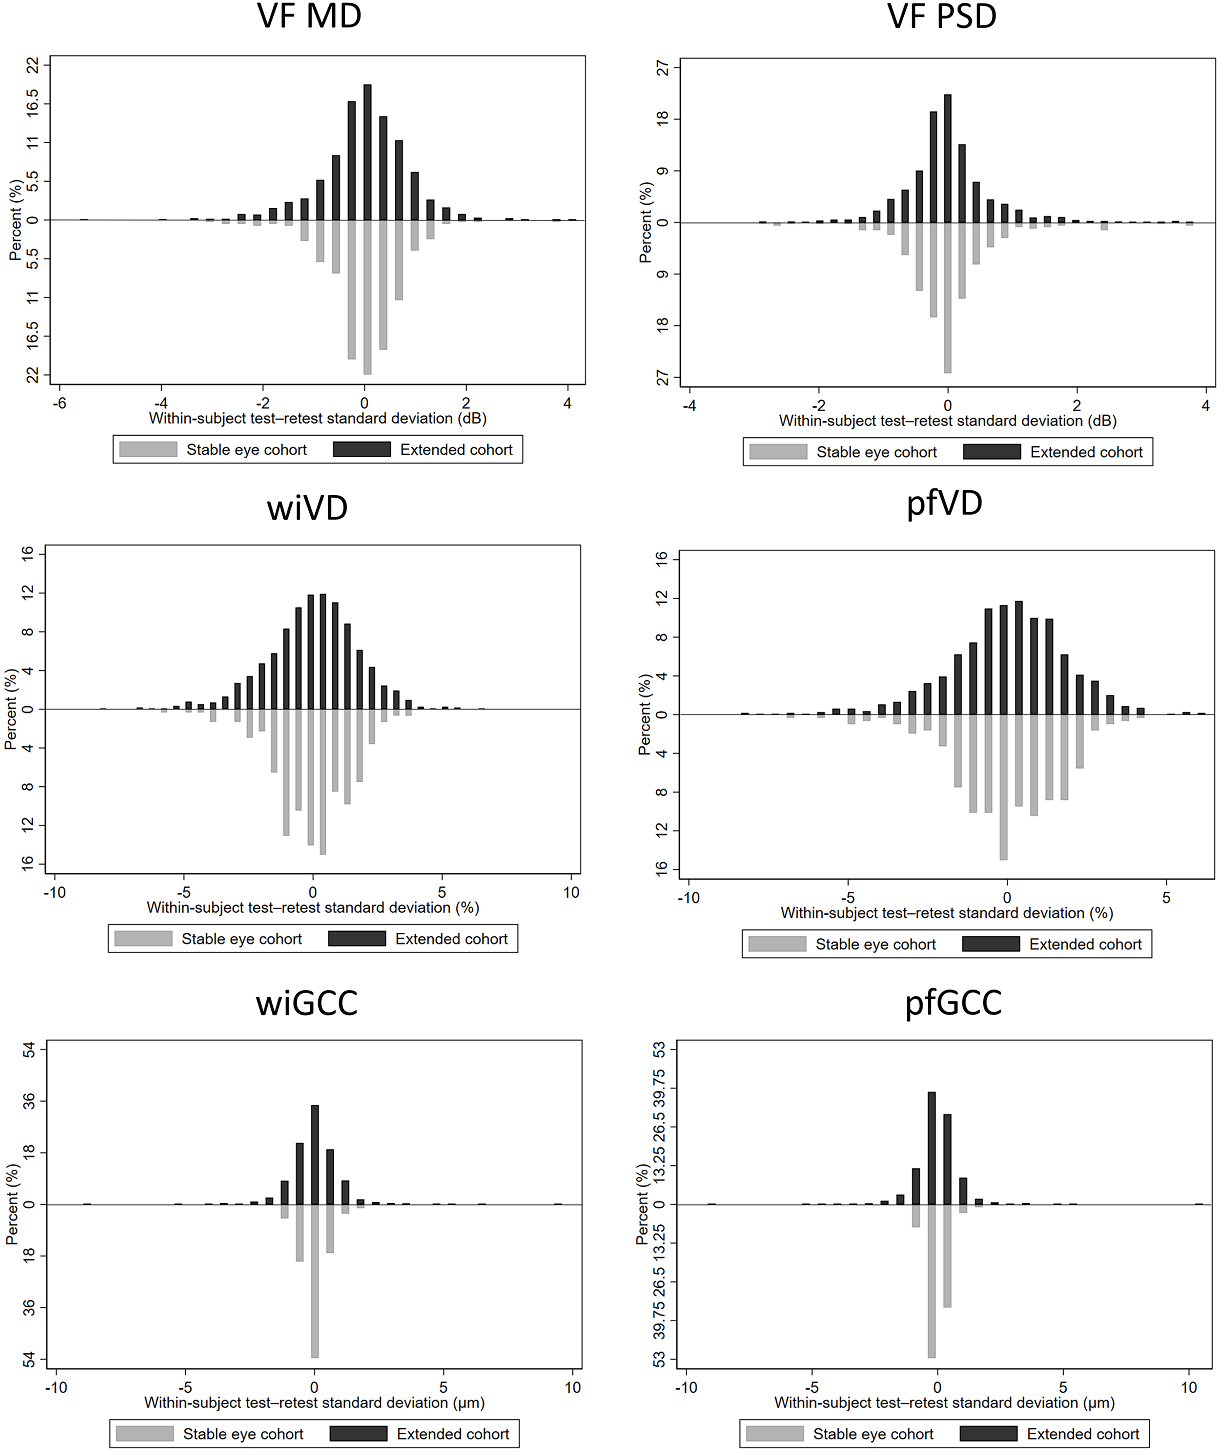
Figure 1.

Distribution of the within-subject test–retest standard deviation of VF and OCT/OCTA parameters in the stable eye cohort (lower panel) and the extended cohort (upper panel) (MD = mean deviation; PSD = pattern standard deviation; VF = visual field; pfGCC = parafoveal ganglion cell complex; pfVD = parafoveal vessel density; wiGCC = whole-image ganglion cell complex; wiVD = whole-image vessel density)
