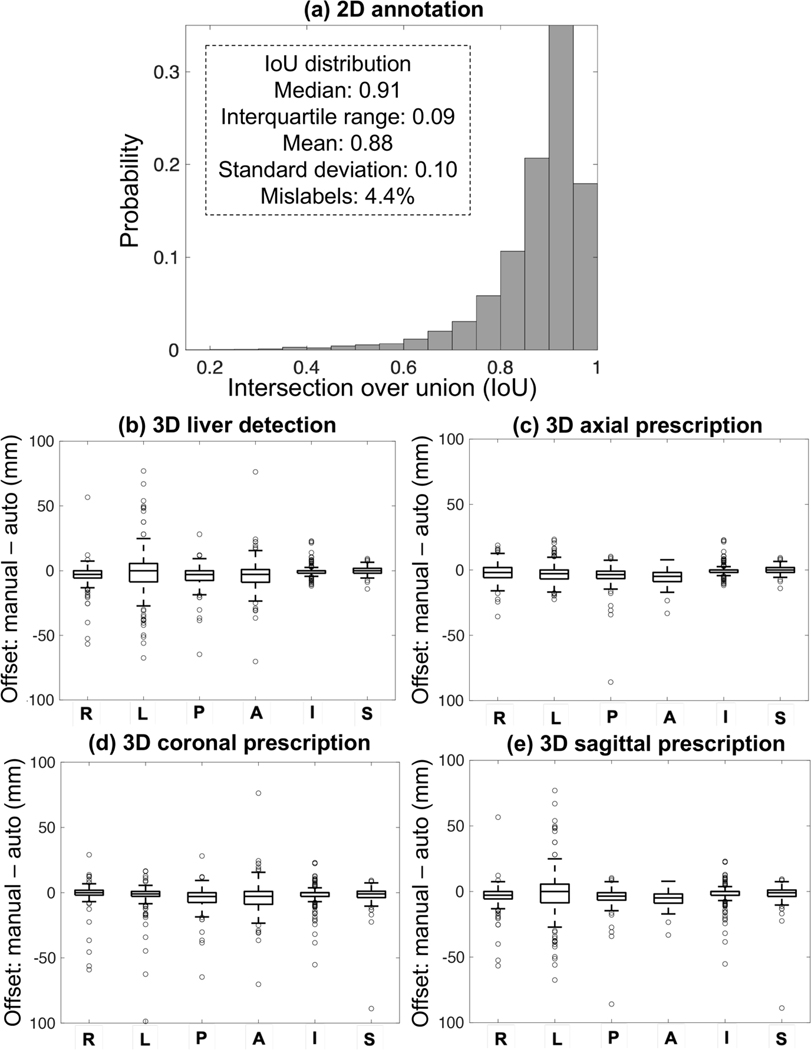
Figure 4.
Accuracy of 2D annotation across all label classes (a), 3D liver detection (b), and 3D image prescription (c-e). IoU histograms for all classes are qualitatively similar, with IoU median >0.91 and interquartile range <0.09. In (b-e), x axis shows the 6 edges: right (R), left (L), posterior (P), anterior (A), inferior (I), and superior (S); y axis shows the difference between automated and manual volumes (0: perfect alignment; negative offset: AI covering more volume; positive offset: missed volume). All boxes are tight around 0. For 3D axial prescription, the shift in the S/I dimension was less than 2.3 cm for 99.5% of the test datasets.

