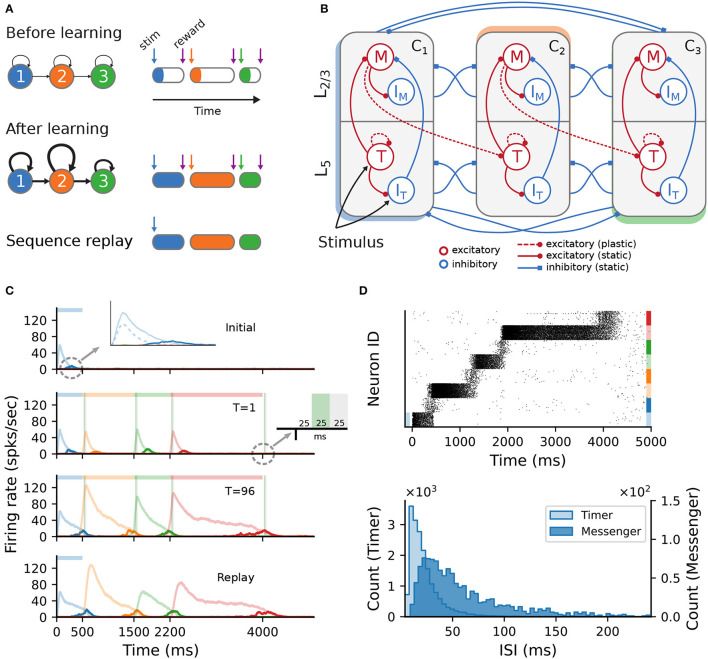
Figure 1.
Sequence learning task and network architecture. (A) A sequence of three intervals (elements) is learned by a network with as many dedicated populations (columns). The individual populations are stimulated sequentially, with a global reward signal given at the beginning and the end of each element. After training, the recurrent and feedforward weights are strengthened, and the sequence is successfully recalled following a cue. The fullness of the colored sections on the right illustrates the duration of the activity (firing rates) above a certain threshold. (B) Each stimulus-specific column is composed of two excitatory, Timers (T) and Messengers (M), and two corresponding inhibitory populations, IT and IM. Solid (dashed) arrows represent fixed static (plastic) connections. Cross-columnar inhibition always targets the excitatory population in the corresponding layer (L5 or L2/3). (C) Firing rates of the excitatory populations during learning (top three plots) and recall (bottom plot) of four time intervals (500; 1,000; 700; and 1,800ms). Light (dark) colors represent T (M) cells. Dashed light blue curve in top panel inset shows the inhibitory population IT in L5. Green (gray) vertical bars show the 25ms reward (trace refractory) period, 25ms after stimulus offset (see inset). (D) Spiking activity of excitatory cells (top) and corresponding ISI distributions (bottom), during recall, for the network in (C). In the raster plot, neurons are sorted by population (T, M) and sequentially by column (see color coding on the right).

