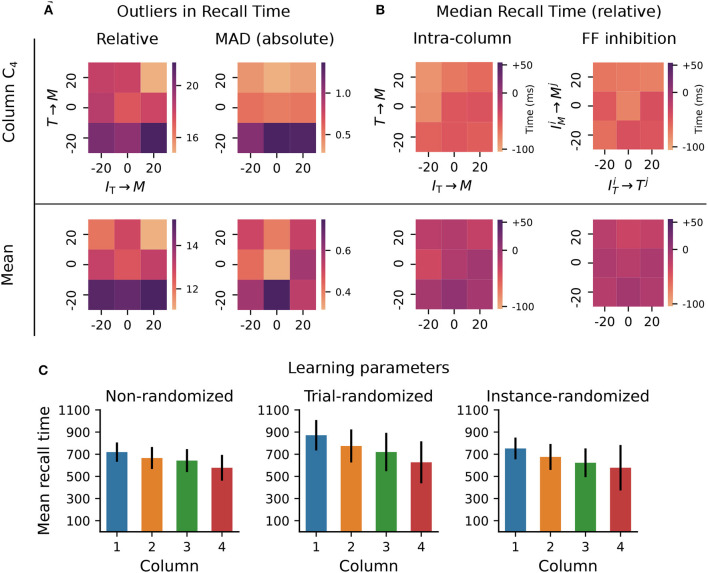
Figure 3.
Robustness to variation in synaptic weights and learning parameters. The system was trained on a sequence of four elements, each with a duration of 700ms. For the Timer cells, we define relative recall time as the recall time relative to stimulation onset, i.e., the time from the expected onset time (0; 7,00; 1,400; 2,100) in the sequence until the rate drops below a threshold of 10spks/sec. Conversely, absolute recall time is simply the time when the rate drops below threshold (relative to 0). (A) Number of outlier intervals reported during 50 recall trials, as a function of the percentage change of two synaptic weights within a column: excitatory Timer to Messenger, and inhibitory IT to Messenger. Top row shows the number of outliers, defined as a deviation of ±140 ms from the correct interval relative to expected onset (left), and the number of outliers detected using a modified z-score (threshold >3, right panel) based on the median absolute deviation in column C4 (see main text). Bottom row shows the respective outliers averaged over all four columns. (B) Deviation of the median recall time from the expected 700ms, as a function of the excitatory and inhibitory synaptic weights onto the Messenger cells in a column (left), and as a function of the cross-columnar (Ci≠Cj) inhibitory synaptic weights within the same layers (right). Top and bottom row as in (A). All data in (A, B) is averaged over 20 network instances. (C) Mean recall time of a four-element sequence of 700ms intervals, over 50 recall trials of a single network instance. Left: baseline network. Center: during each training trial, the learning parameters (see main text) are drawn randomly and independently from a distribution of ±20% around their baseline value. Error bars represent the standard deviation. Right: the set of learning parameters is drawn randomly once for each network instance, with data shown averaged over 10 instances.

