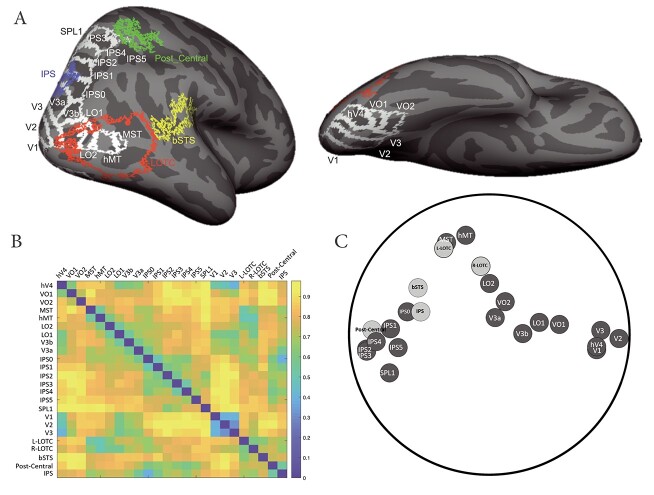
Fig. 5.
(A) Inflated brain surface from a representative participant showing the ROIs examined in lateral and ventral views with white outlines for Wang’s ROIs and colorful outlines for functional ROIs obtained from searchlight analysis. (B) ROI dissimilarity matrix based on the distance between their cross-position decoding accuracy for Wang’s ROI and ROIs obtained from searchlight analysis. Lighter colors show higher distance. (C) MDS plot of Wang’s ROIs (light gray) and ROIs obtained from searchlight analysis (dark gray) and a total least square regression line through the occipitotemporal regions (the light gray line) and another through the parietal regions (the dark gray line). The MDS plot and the lines could capture 0.5522% and 0.4798% of the variance of the ROI dissimilarity matrix.

